Remove Cost-Benefit Remove Interactive Remove Metrics Remove Recreation/Entertainment
article thumbnail

Take Advantage Of The Best Interactive & Effective Data Visualization Examples

datapine

Table of Contents 1) The Benefits Of Data Visualization 2) Our Top 27 Best Data Visualizations 3) Interactive Data Visualization: What’s In It For Me? Whether static or interactive dashboards , these creative data visualization examples will serve as an inspiration for any data enthusiast. No, data is the new soil.”

article thumbnail

30 Best Accounting KPIs and Metric Examples for 2021 Reporting

Jet Global

An accounting Key Performance Indicator (KPI) or metric is an explicitly defined and quantifiable measure that the accounting industry uses to gauge its overall long-term performance. However, if DPO is too high it can indicate that the company may have problems paying its bills.DPO = (Accounts Payable / Cost of Goods Sold) x # of Days.

Metrics 110
Insiders

Sign Up for our Newsletter

This site is protected by reCAPTCHA and the Google Privacy Policy and Terms of Service apply.

Trending Sources

article thumbnail

Rising Tide Rents and Robber Baron Rents

O'Reilly on Data

But this kind of virtuous rising tide rent, which benefits everyone, doesn’t last. Back in 1971, in a talk called “ Designing Organizations for an Information-rich World ,” political scientist Herbert Simon noted that the cost of information is not just money spent to acquire it but the time it takes to consume it. “In

article thumbnail

When models are everywhere

O'Reilly on Data

SCREENS, FEEDBACK, AND “THE ENTERTAINMENT”. Many of the models you interact with are mediated through screens, and there’s no shortage of news about how many of us spend our lives glued to them. In David Foster Wallace’s novel Infinite Jest , there is a video tape known as “The Entertainment.” We shouldn’t be surprised.

Modeling 188
article thumbnail

Amazon OpenSearch Service now supports 99.99% availability using Multi-AZ with Standby

AWS Big Data

However, following those practices is complicated, and can require knowledge of and experience with OpenSearch’s data deployment and management, along with an understanding of how OpenSearch Service interacts with AWS Availability Zones and networking, distributed systems, OpenSearch’s self-healing capabilities, and its recovery methods.

article thumbnail

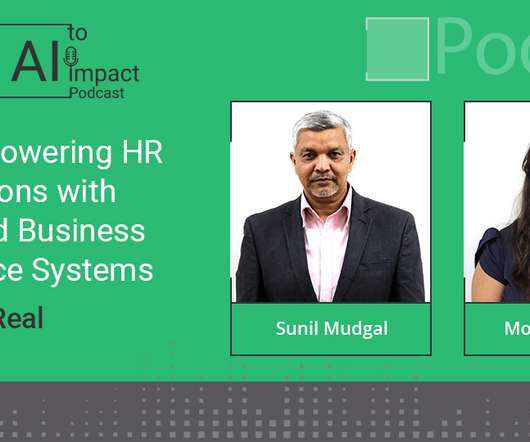
PODCAST: Making AI Real – Episode 3: Empowering HR Organizations with Automated Business Surveillance Systems

bridgei2i

In our latest episode of the AI to Impact podcast, host Monica Gupta – Manager of AI Actions, meets with Sunil Mudgal – Advisor, Talent Analytics, BRIDGEi2i, to discuss the benefits of adopting AI-powered surveillance systems in HR organizations. How do you track and report the impact of these metrics on key business outcomes?

article thumbnail

Make Sure You Know The Difference Between Strategic, Analytical, Operational And Tactical Dashboards

datapine

Organizations can also further utilize the data to define metrics and set goals. By integrating these key performance indicators (KPIs) and goals into their dashboards, companies can proactively identify issues, minimize costs and strive to exceed performance expectations. Benefits Of A Successful Dashboard Implementation.