Remove courses simple-spreadsheets
article thumbnail

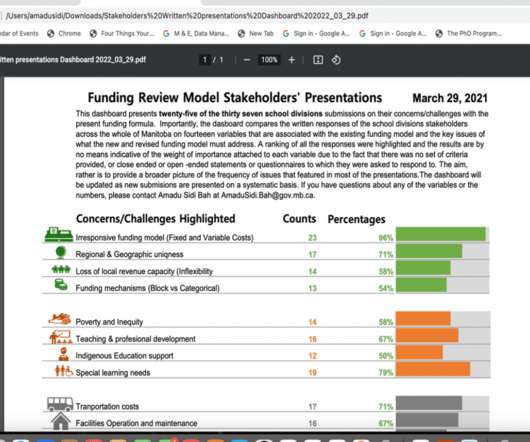
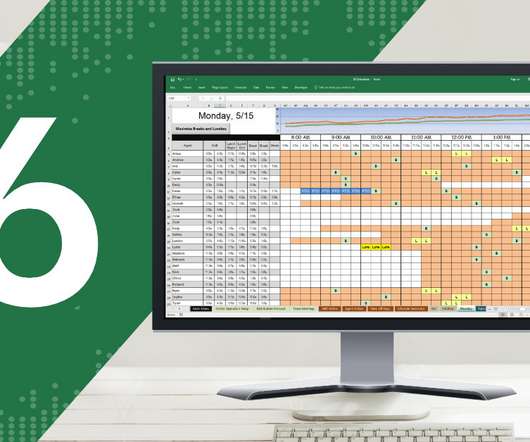
Visualizing 24 School Divisions’ Submissions with a Dashboard in Microsoft Excel

Depict Data Studio

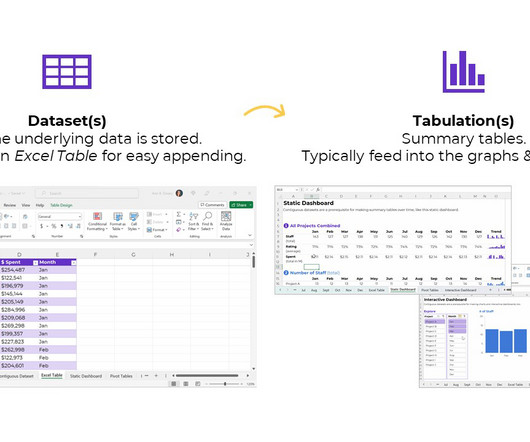
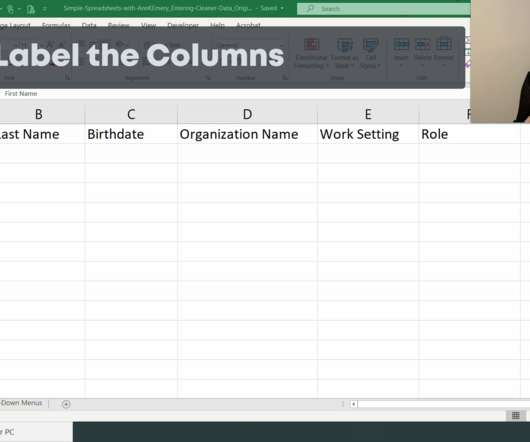
This guest post comes from Amadu Sidi Bah, who’s graduated from our Simple Spreadsheets, Great Graphs, Report Redesign, and Dashboard Design courses. Step 1: Creating an Excel Spreadsheet. I created a spreadsheet from Excel using all the acquired skills I learnt and as professionally as I could.

article thumbnail

Automated Mentoring with ChatGPT

O'Reilly on Data

First, Ruby and Prime Numbers I first tried a Ruby program I wrote about 10 years ago: a simple prime number sieve. Preventing this rewrite is as simple as just adding “Do not rewrite the program” to the prompt. However, it isn’t a serious problem. This program had a few problems–as we’ll see. ChatGPT is good at giving basic advice.

Testing 182
Insiders

Sign Up for our Newsletter

This site is protected by reCAPTCHA and the Google Privacy Policy and Terms of Service apply.

article thumbnail

My 6 Data Communications Classes

Depict Data Studio

Class 1: Simple Spreadsheets: How to Analyze Data from Start to Finish in Excel Need to make sense of spreadsheets? These spreadsheet skills will save your time, energy, and sanity. These spreadsheet skills will save your time, energy, and sanity. If you’re looking for a dataviz course, this isn’t it.

article thumbnail

Looking Ahead to 2024: What’s Coming to Depict Data Studio 

Depict Data Studio

Here’s what’s in store for 2024 related to: Online Courses, Private Training, Conference Keynotes, and My Personal and Professional Goals. Online Courses The biggest improvement for 2024 is that all 6 courses will be offered LIVE (!!!). The #1 roadblock is that participants don’t have time for recorded courses.

article thumbnail

Two Types of Tables: Datasets vs. Tabulations

Depict Data Studio

Master dataset : This is a direct synonym — and this is the term I learned in undergraduate and graduate statistics courses — but we don’t use slavery terms anymore. If you’re in Simple Spreadsheets then you’ve heard me talk about this a lot. Tabulations are tables where the datasets are summarized.

article thumbnail

Humanity in Data Visualization: Designing a One-Pager for My Grandma’s Caregivers

Depict Data Studio

I registered for the Simple Spreadsheets course because I was a beginner with using Excel and I knew I was utilizing only a fraction of its capabilities. It made sense to me to organize the info into two columns, and I made the text as clear and simple as possible. The Result. Unfortunately, grandma is no longer with us.

article thumbnail

Applying Data Visualization Principles to Your Business: A Before/After One-Pager Makeover

Depict Data Studio

So, I sufficed with Ann’s free Soar Beyond the Dusty Shelf Report course and blog posts. Ann’s Dashboard Design was one of the first courses I wanted to sign up for. I registered for the Dashboard Design course along with Simple Spreadsheets , Great Graphs: Design Principles , and Great Graphs: Excel How-To’s.