Remove dashboard-examples-and-templates procurement
article thumbnail

Understanding The Value Of Column Charts With Examples & Templates 

datapine

2) Pros & Cons Of Column Charts 3) When To Use A Column Graph 4) Types Of Column Charts 5) Column Graphs & Charts Best Practices 6) Column Chart Examples Data visualization has been a part of our lives for many many years now. Let’s get started with the definition! What Is A Column Chart or Graph?

article thumbnail

Take Advantage Of Modern CEO Dashboards – Examples And Templates

datapine

Exclusive Bonus Content: Reap the benefits of dashboards for CEOs! CEO dashboards and CEO reports are the answer. By leveraging the power of an online dashboard , an executive story can be written effortlessly, and within minutes. What Is A CEO Dashboard? Download our short summary and become the best leader you can be!

Insiders

Sign Up for our Newsletter

This site is protected by reCAPTCHA and the Google Privacy Policy and Terms of Service apply.

article thumbnail

Procurement Report & Dashboard: Templates, Metrics, Tools

FineReport

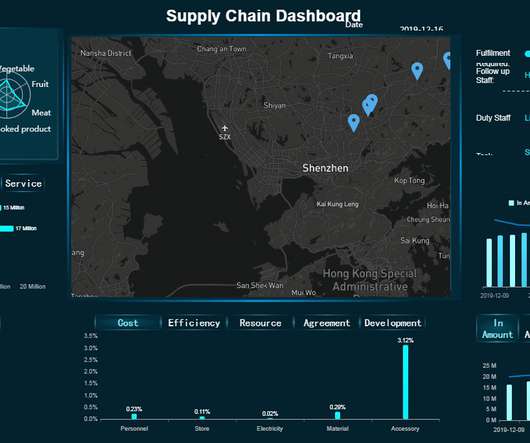
Nowadays, more and more companies choose digital procurement as one of their long-term cost-saving strategies. The importance of procurement reports is becoming more and more prominent. What Is a Procurement Report? What Is a Procurement Report? Purchase Reporting Dashboard(from FineReport). Free Download.

article thumbnail

Best Dashboard Ideas & Design Examples To Boost Your Business Success

datapine

With so much data available to today’s brands and businesses, to extract every drop of value from an ever-growing raft of digital insights and set the kind of KPIs that will drive your venture forward, having an easy to use, a visually-stunning dashboard is key. Exclusive Bonus Content: 15 Powerful Dashboard Ideas: A Summary.

article thumbnail

Your Ultimate Guide To Modern KPI Reports In The Digital Age – Examples & Templates

datapine

Here, we’ll explain the KPI data and reporting in greater detail, ask the question ‘what is KPI reporting,’ look at how to create a KPI report, and explore the dynamics of a KPI report template. What does this mean? One of the most effective means of doing this is by utilizing KPI reporting tools. Get our free guide! What Is A KPI?

KPI 223
article thumbnail

Your Definitive Guide To Building Valuable Narratives Through Data Storytelling

datapine

Here, we’ll explore the unrivaled power of data storytelling in the digital age while looking at a mix of powerful data storytelling examples generated with a modern dashboard creator. Exclusive Bonus Content: Your definitive guide to data storytelling! Download our free executive summary and start creating your stories!

KPI 193
article thumbnail

A Beginner’s Guide To Inventory Metrics And Best Practices

datapine

In the matter, data analysis and dashboard designer software is a precious ally. In this article, we will take a closer look at the inventory management: what are the performance indicator that can help, how to choose them, and outline some inventory metrics examples as well as best practices. How To Choose The Right Inventory KPIs?

Metrics 286