article thumbnail

Move Beyond Excel, PowerPoint And Static Business Reporting with Powerful Interactive Dashboards

datapine

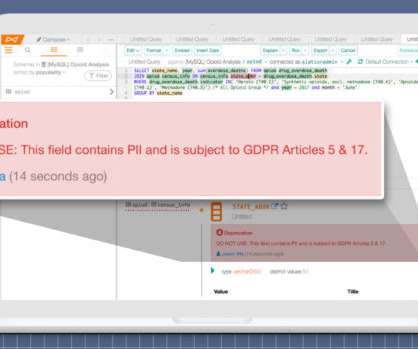
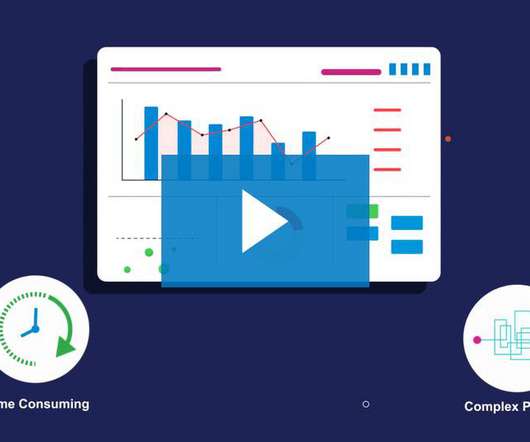
Soon businesses of all sizes will have so much amount of information that dashboard software will be the most invaluable resource a company can have. Visualizing the data and interacting on a single screen is no longer a luxury but a business necessity. That’s why we welcome you to the world of interactive dashboards.

article thumbnail

Everything You Need to Know About Project Management Dashboard

FineReport

Thus, one tool that has gained significant popularity in recent years is the Project Management Dashboard. Moreover, the implementation of an effective Project Management Dashboard facilitates data-driven decision-making and sustainable business success. What Is A Project Management Dashboard?

Insiders

Sign Up for our Newsletter

This site is protected by reCAPTCHA and the Google Privacy Policy and Terms of Service apply.

Trending Sources

article thumbnail

10 Examples of How Big Data in Logistics Can Transform The Supply Chain

datapine

Table of Contents 1) Benefits Of Big Data In Logistics 2) 10 Big Data In Logistics Use Cases Big data is revolutionizing many fields of business, and logistics analytics is no exception. The complex and ever-evolving nature of logistics makes it an essential use case for big data applications. Did you know?

Big Data 275
article thumbnail

Understanding Data Drill Down And Drill Through Analysis And Their Role In Efficient Reporting

datapine

3) The Role Of Data Drilling In Reporting. It is no secret that the business world is becoming more data-driven by the minute. Every day, more and more decision-makers rely on data coming from multiple sources to make informed strategic decisions. Table of Contents. 1) What Is A Drill Down? 2) What Is A Drill Through?

Reporting 173
article thumbnail

Your Ultimate Guide To Modern KPI Reports In The Digital Age – Examples & Templates

datapine

Moreover, within just five years, the number of smart connected devices in the world will amount to more than 22 billion – all of which will produce colossal sets of collectible, curatable, and analyzable data, claimed IoT Analytics in their industry report. What does this mean? Looking for a bite-sized introduction to reporting?

KPI 223
article thumbnail

Tableau further democratizes analytics with AI-fueled features

CIO Business Intelligence

At Tableau Conference 2024 in San Diego today, Tableau announced new AI features for Tableau Pulse and Einstein Copilot for Tableau, along with several platform improvements aimed at democratizing data insights. This is really empowering everyone to be a data expert,” Maxon said. “It Metrics Bootstrapping.

article thumbnail

DataOps For Business Analytics Teams

DataKitchen

Data tables from IT and other data sources require a large amount of repetitive, manual work to be used in analytics. Business analysts sometimes perform data science, but usually, they integrate and visualize data and create reports and dashboards from data supplied by other groups.