Remove Dashboards Remove Data Warehouse Remove Reporting Remove Software
article thumbnail

5 misconceptions about cloud data warehouses

IBM Big Data Hub

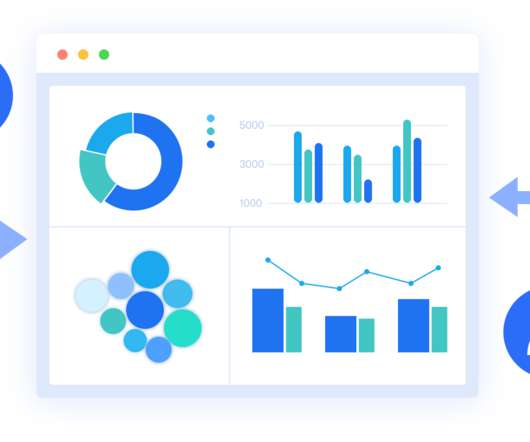
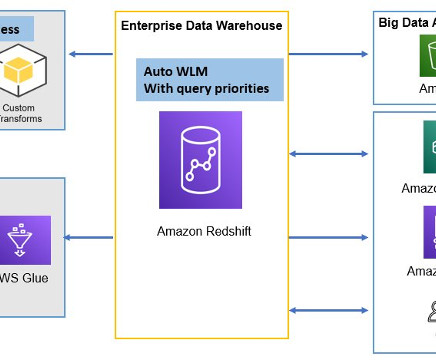
In today’s world, data warehouses are a critical component of any organization’s technology ecosystem. They provide the backbone for a range of use cases such as business intelligence (BI) reporting, dashboarding, and machine-learning (ML)-based predictive analytics, that enable faster decision making and insights.

article thumbnail

Financial Dashboard: Definition, Examples, and How-tos

FineReport

In today’s dynamic business environment, gaining comprehensive visibility into financial data is crucial for making informed decisions. This is where the significance of a financial dashboard shines through. What is A Financial Dashboard? These reports include the cash flow statement, income statement, and balance sheet.

Insiders

Sign Up for our Newsletter

This site is protected by reCAPTCHA and the Google Privacy Policy and Terms of Service apply.

Trending Sources

article thumbnail

Combine transactional, streaming, and third-party data on Amazon Redshift for financial services

AWS Big Data

The following are some of the key business use cases that highlight this need: Trade reporting – Since the global financial crisis of 2007–2008, regulators have increased their demands and scrutiny on regulatory reporting. This will be your OLTP data store for transactional data. version cluster. version cluster.

article thumbnail

Reporting System: Everything You Need to Know

FineReport

When mentioning the reporting, folders loaded with spreadsheets, graphs, and commentaries may ring a bell. With the development of enterprise informatization, there are more and more kinds of data produced, and the demand for reports surges day by day. What is the Reporting System? Software to Build Reporting System.

article thumbnail

Enhance monitoring and debugging for AWS Glue jobs using new job observability metrics, Part 3: Visualization and trend analysis using Amazon QuickSight

AWS Big Data

Grafana provides powerful customizable dashboards to view pipeline health. QuickSight makes it straightforward for business users to visualize data in interactive dashboards and reports. You can slice data by different dimensions like job name, see anomalies, and share reports securely across your organization.

Metrics 104
article thumbnail

Business Intelligence Technologies: Definitive Guide

FineReport

If you have never heard of BI, I suggest you read these two articles, one on BI and analytics and one on BI reporting , to build your background knowledge. BI technology is a series of technologies that can handle a large amount of structured and sometimes unstructured data. Data warehouse. Data querying & discovery.

article thumbnail

Effective Report Design: a step-by-step guide

FineReport

The design of reports can be considered from two aspects: layout and system. You may have seen many articles emphasize how to improve the layout of the report. Today, let’s learn the report designing from the perspective of the report system. The Basics of Report Designing . The Basics of Report Designing .