article thumbnail

Best 3 Mainstream Dashboard Apps–Examples and Demos

FineReport

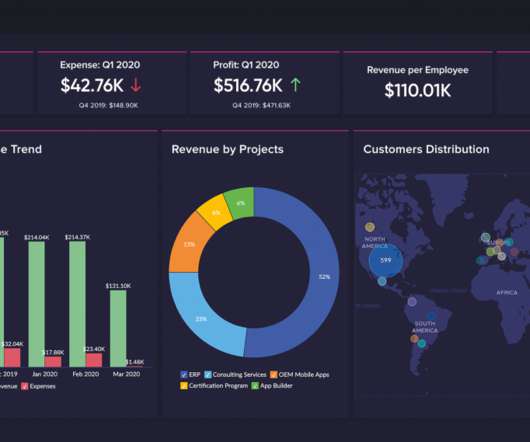
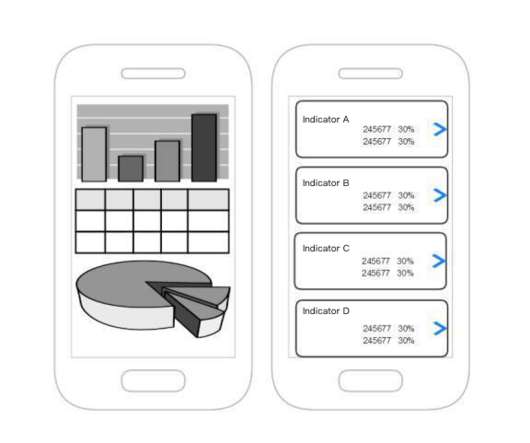
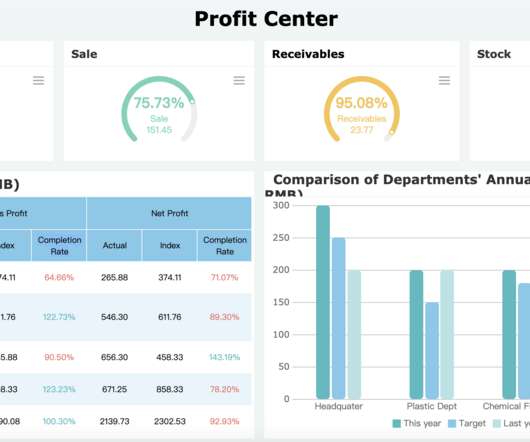
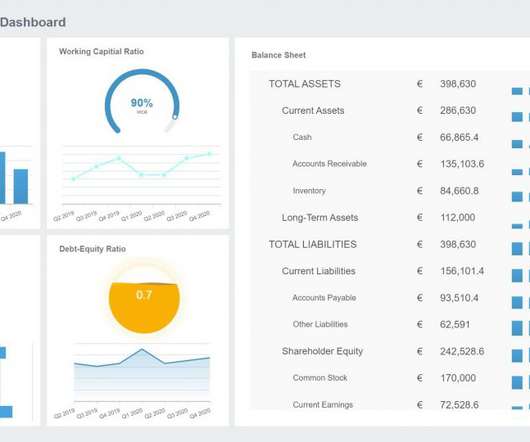
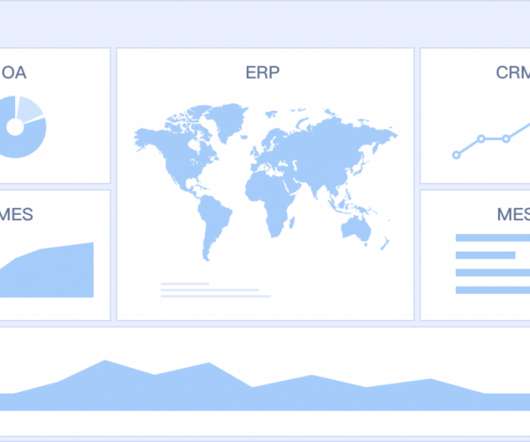
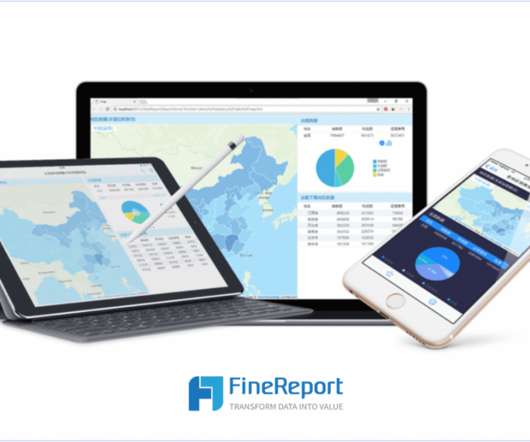
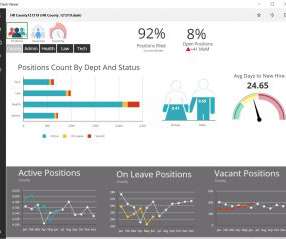
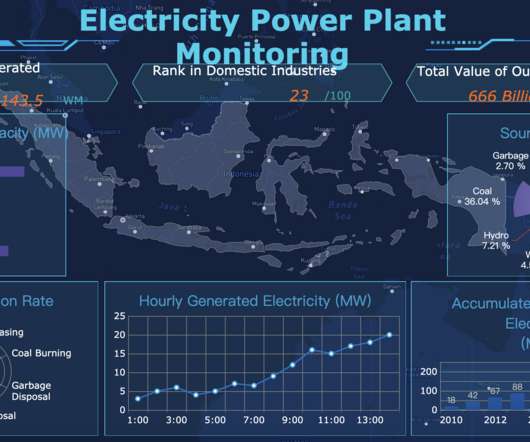
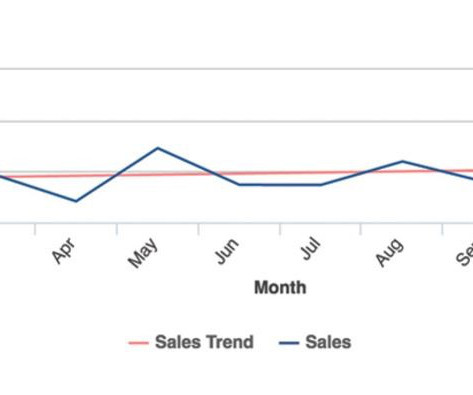
What is Dashboard APP? A dashboard app is a data management software application. With it, you could visually track, analyze and display graph, charts, key performance indicators to monitor the progress of your business. Dashboard Examples. FineReport Dashboard aimes to translate data into commercially valuable insights.

article thumbnail

Enhance monitoring and debugging for AWS Glue jobs using new job observability metrics, Part 3: Visualization and trend analysis using Amazon QuickSight

AWS Big Data

Grafana provides powerful customizable dashboards to view pipeline health. QuickSight makes it straightforward for business users to visualize data in interactive dashboards and reports. QuickSight makes it straightforward for business users to visualize data in interactive dashboards and reports.

Metrics 104
Insiders

Sign Up for our Newsletter

This site is protected by reCAPTCHA and the Google Privacy Policy and Terms of Service apply.

Trending Sources

article thumbnail

Learn Data Visualization Techniques for Impactful Visual Representations

FineReport

Learn Data Visualization Understanding the Importance of Visualizing Data Data visualization is a powerful tool for conveying complex information in a clear and impactful manner. Whether it’s through charts, graphs, maps, or other visual formats, mastering data visualization is crucial for anyone working with data.

article thumbnail

Mastering BI Dashboard Tools: Your Essential Guide

FineReport

In today’s data-driven landscape, businesses are leaning more on BI tools , particularly BI dashboard solutions, to enhance decision-making through data visualization. These BI Dashboard tools blend advanced analytics with user-friendly interfaces, revealing invaluable insights.

article thumbnail

What is Data Visualization: Complete Guide 2024

FineReport

What is Data Visualization Understanding the Concept Data visualization, in simple terms, refers to the presentation of data in a visual format. By utilizing visual elements, data visualization allows individuals to grasp difficult concepts or identify new patterns within the data.

article thumbnail

What is IoT Dashboard?

FineReport

Among the tools that have emerged from this digital transformation, IoT dashboards stand out as invaluable assets. In this article, we will explore the concept of IoT dashboards, delve into their benefits, examine real-life examples, and highlight the essential features that make them indispensable in the IoT landscape.

IoT 52
article thumbnail

Mastering Data Visualization Jobs: Your Step-by-Step Career Guide

FineReport

Discovering the World of Data Visualization Jobs In today’s data-driven world, data visualization jobs play a crucial role in transforming complex information into visually appealing and easy-to-understand graphics. But what exactly are data visualization jobs, and why are they important?