article thumbnail

Customer Retention Dashboard & Metrics Examples For Modern Companies

datapine

A customer retention dashboard and metrics depicted in a neat visual will help you in monitoring, analyzing, and managing multiple customer-centric points and how they echo in your business. Your Chance: Want to build a dashboard for customer retention? Try our professional dashboard software for 14 days, completely free!

article thumbnail

Top 15 Warehouse KPIs & Metrics For Efficient Management 

datapine

3) Top 15 Warehouse KPIs Examples 4) Warehouse KPI Dashboard Template The use of big data and analytics technologies has become increasingly popular across industries. Making the use of warehousing metrics a huge competitive advantage. That is where warehouse metrics and KPIs come into play. 2) Why Do You Need Warehouse KPIs?

Metrics 217
Insiders

Sign Up for our Newsletter

This site is protected by reCAPTCHA and the Google Privacy Policy and Terms of Service apply.

Trending Sources

article thumbnail

Procurement Report & Dashboard: Templates, Metrics, Tools

FineReport

Purchasing analysis is usually represented as dashboards, reports, and data graphs, analyzing the company’s spending on suppliers by category or location. Purchase Reporting Dashboard(from FineReport). Purchasing Center Dashboard. Purchasing Dashboard/Report & Key Metrics. Purchasing Reports Samples.

article thumbnail

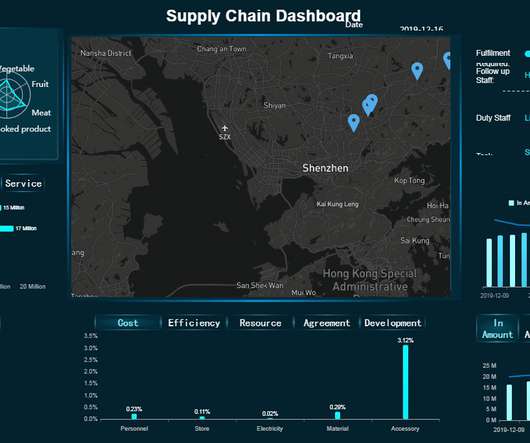
15 Supply Chain Metrics & KPIs You Need For A Successful Business

datapine

That’s why it’s critical to monitor and optimize relevant supply chain metrics. Finally, we will show how to combine those metrics with the help of modern KPI software and create professional supply chain dashboards. Your Chance: Want to visualize & track supply chain metrics with ease?

Metrics 260
article thumbnail

Top Productivity Metrics Examples & KPIs To Measure Performance And Outcomes

datapine

1) What Are Productivity Metrics? 3) Productivity Metrics Examples. 4) The Value Of Workforce Productivity Metrics. Today, employee output is no longer represented by vague descriptions, but by isolated figures that offer insight for improvement in specific areas, which can be found on an HR dashboard. Table of Contents.

article thumbnail

Enhance monitoring and debugging for AWS Glue jobs using new job observability metrics, Part 3: Visualization and trend analysis using Amazon QuickSight

AWS Big Data

In Part 2 of this series, we discussed how to enable AWS Glue job observability metrics and integrate them with Grafana for real-time monitoring. Grafana provides powerful customizable dashboards to view pipeline health. QuickSight makes it straightforward for business users to visualize data in interactive dashboards and reports.

Metrics 107
article thumbnail

Get Started With Business Performance Dashboards – Examples & Templates

datapine

That said, if you’re looking to evolve your empire, increase brand awareness, and boost your bottom line, embracing business performance dashboards and big data should be at the top of your priority list. You need data-driven decisions, and a dashboard for business performance will make sure you reap the best possible rewards.