Remove Dashboards Remove Forecasting Remove Reporting Remove Slice and Dice
article thumbnail

Move Beyond Excel, PowerPoint And Static Business Reporting with Powerful Interactive Dashboards

datapine

Soon businesses of all sizes will have so much amount of information that dashboard software will be the most invaluable resource a company can have. That’s why we welcome you to the world of interactive dashboards. Your Chance: Want to test interactive dashboard software for free? What Is An Interactive Dashboard?

article thumbnail

Best Reporting Tools List You Can’t Miss in 2020

FineReport

Reporting tools play vital importance in transforming data into visual graphs and charts, presenting data in an attractive and intuitive manner. An excellent reporting tool will let you gather information conveniently and to have a comprehensive view of your business. Reporting Tools VS BI Reporting . Crystal Reports.

Insiders

Sign Up for our Newsletter

This site is protected by reCAPTCHA and the Google Privacy Policy and Terms of Service apply.

Trending Sources

article thumbnail

Tally ERP and Analytics with Mobile and Desktop Access!

Smarten

Integrating analytics with Tally ERP can add crucial value by allowing your professionals to go beyond simple reporting to analyze data, spot trends, identify opportunities and solve problems. Using analytics for planning and forecasting is a critical factor in success. There is good reason for this growth.

article thumbnail

How to Streamline Yardi Financial Reporting

Jet Global

Yardi offers a variety of different tools for reporting; unfortunately, each has its own unique shortcomings. Reporting in Yardi: the Default Options. There are no options for modifying the format of these reports, and in many cases, they may only provide a subset of results.

article thumbnail

Trakstar unlocks new analytical opportunities for its HR customers with Amazon QuickSight

AWS Big Data

It’s powered by Amazon QuickSight , a cloud-native business intelligence (BI) tool that enables embedded customized, interactive visuals and dashboards within the product experience. QuickSight allowed us to focus on building dashboards that address key pain points for customers and rapidly innovate.

article thumbnail

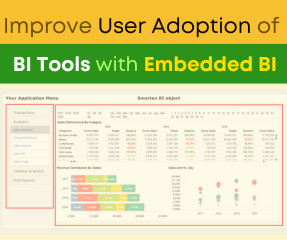
Improve User Adoption of BI Tools with Embedded BI!

Smarten

Integrate objects (Dashboards, Crosstab, Tabular, KPIs, Graphs, Reports, models, Clickless Analytics and more).’ Embedded BI and Augmented Analytics includes traditional BI components like dashboards, KPIs, reports with interactive drill-down, drill through, slice and dice and self-serve analytics capabilities.

article thumbnail

A Mobile BI App Can Help Your Team Improve Efficiency!

Smarten

Mobile BI solutions with self-serve features and flexible collaboration and reporting will give your team the tools they need to make decisions, solve problems and gain critical insight into issues, opportunities and trends within the enterprise.