Remove Dashboards Remove Information Remove Measurement Remove Scorecard
article thumbnail

Dashboard vs. Scorecard: Differences, Advantages, Templates

FineReport

As important parts of business intelligence, scorecards and dashboards can both play an obvious role in promoting enterprise performance management. However, many users are confused with the difference between scorecard vs. dashboard. Definition of scorecard and dashboard. What is a scorecard?

article thumbnail

Build Up Your Performance With KPI Scorecards – Examples & Templates

datapine

In fact, data has become the raw material that every business decision is based on while reporting tools create the environment to act on generated information swiftly and accurately. Tracking the success metrics based on your needs, and the time frame you select while comparing your values can be done with simple yet effective scorecards.

Scorecard 226
Insiders

Sign Up for our Newsletter

This site is protected by reCAPTCHA and the Google Privacy Policy and Terms of Service apply.

article thumbnail

Scorecard vs Dashboard: How to Choose to Maximize Your Benefits?

FineReport

As important parts of business intelligence, scorecard and dashboard can both play an obvious role in promoting enterprise development. However, limited by factors such as cost and corporate strategies, sometimes companies need to make a choice between scorecard vs dashboard. Definition of scorecard and dashboard.

article thumbnail

A Beginner’s Guide To Inventory Metrics And Best Practices

datapine

In the matter, data analysis and dashboard designer software is a precious ally. We will finish by presenting a business dashboard that will show how those metrics work together when depicting an inventory data-story. Your Chance: Want to visualize & track inventory KPIs with ease? What Are Inventory Metrics?

Metrics 286
article thumbnail

Visualize data quality scores and metrics generated by AWS Glue Data Quality

AWS Big Data

AWS Glue Data Quality allows you to measure and monitor the quality of data in your data repositories. AWS Glue Data Quality generates a substantial amount of operational runtime information during the evaluation of rulesets. We can query and submit the Athena data to QuickSight to create visuals for the dashboard.

article thumbnail

A Complete Guide On How To Set Smart KPI Targets And Goals

datapine

In order to really ensure you are growing and making the most out of your data-driven efforts, it is necessary to implement measurable goals that will allow you to efficiently assess your strategic efforts. KPIs are a type of measurement that helps organizations evaluate their success in different activities and areas.

KPI 152
article thumbnail

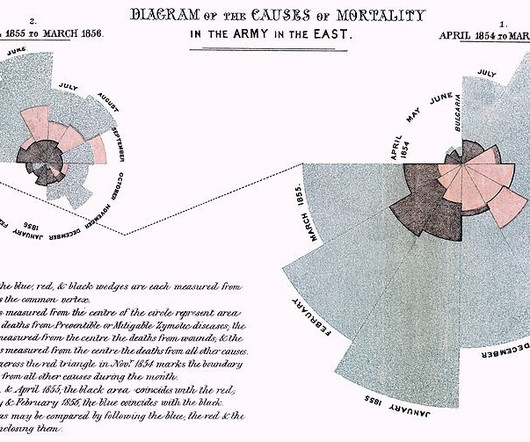
A Brief History of Data Visualization

Jet Global

As the demand grew for more accurate mapping and physical measurement, better visualizations were needed. What is notable here is that while Van Langren could have provided this information in a table, it is the use of the graph that really visually displays the wide variations in estimates.