Remove Dashboards Remove Interactive Remove IT Remove Measurement
article thumbnail

Take Advantage Of The Best Interactive & Effective Data Visualization Examples

datapine

Table of Contents 1) The Benefits Of Data Visualization 2) Our Top 27 Best Data Visualizations 3) Interactive Data Visualization: What’s In It For Me? Whether static or interactive dashboards , these creative data visualization examples will serve as an inspiration for any data enthusiast. No, data is the new soil.”

article thumbnail

Get Started With Interactive Weekly Reports For Performance Tracking

datapine

This is where interactive weekly reports come into the picture. Powered by interactive visualizations, managers use these reports to outline the progress of the week and find improvement opportunities for the future. We will see these interactive reports in action throughout the post. Let’s kick it off with the definition.

Insiders

Sign Up for our Newsletter

This site is protected by reCAPTCHA and the Google Privacy Policy and Terms of Service apply.

Trending Sources

article thumbnail

How to Plan for Your Next Dashboard [Lea Pica’s Present Beyond Measure Podcast]

Depict Data Studio

You’ve been asked to make a dashboard—now what?! Dashboard is a tricky term; it means different things to different people. In this article, you’ll learn how to: choose between various dashboard types (static or interactive, single or series); and deal with common dashboard challenges. What’s Inside.

article thumbnail

A Guide To Performing Successful Content Reporting Using Modern Dashboards

datapine

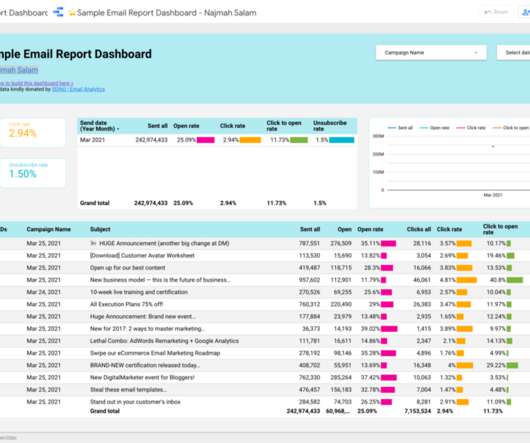
2) What Is A Content Dashboard? 4) Content Dashboards Examples. That said, measuring the success of your those efforts is another great part of the job, and on many occasions, it can prove to be overwhelming as you need to use multiple tools to gather the data. What Is A Content Dashboard? Enter modern content reports.

article thumbnail

An Introduction To Data Dashboards: Meaning, Definition & Industry Examples

datapine

Enter data dashboards – one of history’s best innovations in business intelligence. To help you understand this notion in full, we’re going to explore a data dashboard definition, explain the power of dashboard data, and explore a selection of data dashboard examples. What Is A Data Dashboard? Arthur Conan Doyle.

article thumbnail

14 Dashboard Design Principles & Best Practices To Enhance Your Data Analysis

datapine

The rise of innovative, interactive, data-driven dashboard tools has made creating effective dashboards – like the one featured above – swift, simple, and accessible to today’s forward-thinking businesses. Dashboard design should be the cherry on top of your business intelligence (BI) project. Consider your end goal.

article thumbnail

Utilize The Undeniable Power Of Professional COO Dashboards & Reports

datapine

We won’t delve into details about the career prospects of this C-level position but we will present COO dashboards and reports that are critical for helping chief operating officers across the world to effectively manage their time, company, operational processes, and results. How to create a COO dashboard? What is a COO report?