Remove Dashboards Remove Interactive Remove Optimization Remove Visualization
article thumbnail

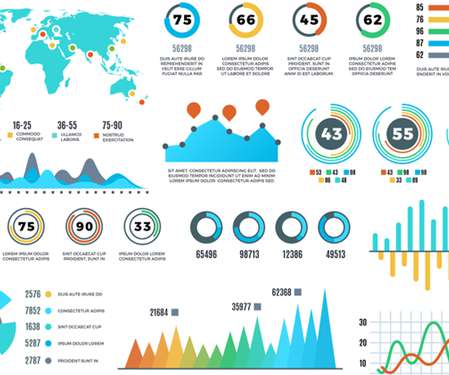
Take Advantage Of The Best Interactive & Effective Data Visualization Examples

datapine

Table of Contents 1) The Benefits Of Data Visualization 2) Our Top 27 Best Data Visualizations 3) Interactive Data Visualization: What’s In It For Me? 4) Static vs. Animated Data Visualization Data is the new oil? ” – David McCandless Humans are visual creatures. No, data is the new soil.”

article thumbnail

Get Started With Interactive Weekly Reports For Performance Tracking

datapine

This is where interactive weekly reports come into the picture. Armed with powerful visualizations and real-time data, modern weekly summary reports enable businesses to closely monitor their performance and the progress of their strategies to extract relevant insights and optimize their processes to ensure constant growth.

Insiders

Sign Up for our Newsletter

This site is protected by reCAPTCHA and the Google Privacy Policy and Terms of Service apply.

Trending Sources

article thumbnail

Your Guide To Modern Agency Analytics, Dashboards & Reporting Techniques

datapine

The answer is modern agency analytics reports and interactive dashboards. Starting with its definition, following with the benefits of agency reports, a list of tools, and a set of agency dashboard examples. Explore our 14 days free trial & benefit from interactive agency reports! What Are Agency Analytics?

article thumbnail

Apply Modern CRM Dashboards & Reports Into Your Business – Examples & Templates

datapine

With a powerful dashboard maker , each point of your customer relations can be optimized to maximize your performance while bringing various additional benefits to the picture. Finally, we will show you a real-life example so you can get a visual overview and a clearer picture of the points discussed in this article.

article thumbnail

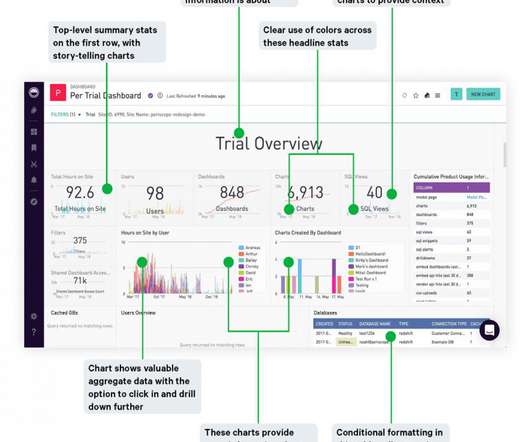
An Introduction To Data Dashboards: Meaning, Definition & Industry Examples

datapine

Enter data dashboards – one of history’s best innovations in business intelligence. To help you understand this notion in full, we’re going to explore a data dashboard definition, explain the power of dashboard data, and explore a selection of data dashboard examples. What Is A Data Dashboard? click to enlarge**.

article thumbnail

Unveiling the Path to Success as a Data Visualization Specialist

FineReport

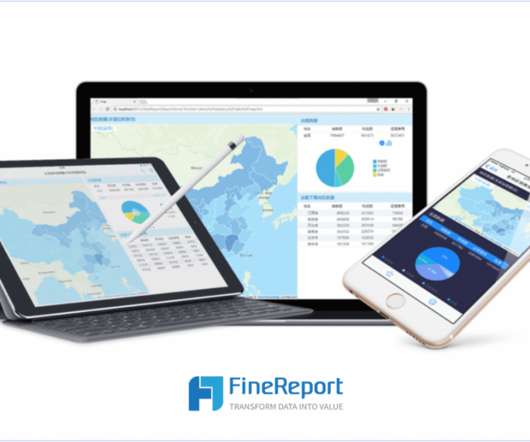
In today’s data-driven world, the data visualization specialist plays a pivotal role in transforming complex information into visually appealing formats. As companies seek to leverage data visualization expertise, individuals with the ability to present data in innovative ways are highly sought after.

article thumbnail

Your Introduction To CFO Dashboards & Reports In The Digital Age

datapine

CFO dashboards exist to enhance the strategic as well as the analytical efforts related to every financial aspect of your business. Here, we’ll explore the dynamics of reports for CFOs, look at CFO reporting tools, and consider real-world examples of both CFO dashboards and reports. Benefit from great CFO dashboards & reports!