Remove Dashboards Remove Key Performance Indicator Remove Reference Remove ROI
article thumbnail

Utilize The Potential Of Digital Dashboards In A Business Environment

datapine

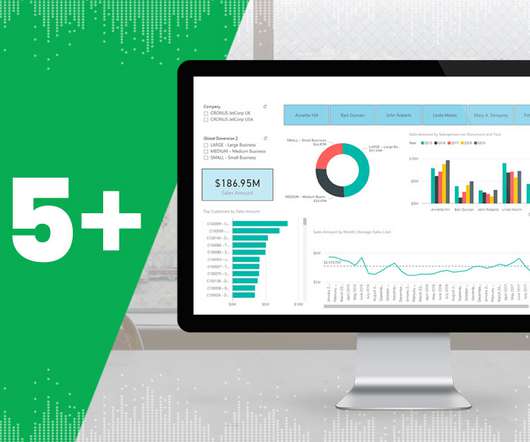
Digital dashboards not only help you to drill down into the insights that matter most to your business, but they also offer an interactive visual representation that assists in swifter, more informed decision-making as well as the discovery of priceless new insights. Your Chance: Want to build your own digital dashboard with a few clicks?

article thumbnail

Move Beyond Excel, PowerPoint And Static Business Reporting with Powerful Interactive Dashboards

datapine

Soon businesses of all sizes will have so much amount of information that dashboard software will be the most invaluable resource a company can have. That’s why we welcome you to the world of interactive dashboards. Your Chance: Want to test interactive dashboard software for free? What Is An Interactive Dashboard?

Insiders

Sign Up for our Newsletter

This site is protected by reCAPTCHA and the Google Privacy Policy and Terms of Service apply.

Trending Sources

article thumbnail

BI Dashboard Best Practices And The Power Of Knowledge In The Digital Age

datapine

An online BI dashboard. Thanks to specific business intelligence best practices for dashboard design. Exclusive Bonus Content: Download Our Free Dashboard Checklist! Get the free guide with great tips for your dashboard implementation! What Is The Definition Of A BI Dashboard? How can you create one?

article thumbnail

KPIs vs Metrics: Understanding The Differences With Tips & Examples

datapine

Essentially, Key Performance Indicators or KPIs measure performance or progress based on specific business goals and objectives. A pivotal element to consider is the word “key”, meaning they only track what is truly relevant for the company’s strategic decisions. What Are KPIs?

Metrics 189
article thumbnail

Best 10 Dashboard Reporting Tools You Can’t Miss

FineReport

Dashboard reporting refers to putting the relevant business metrics and KPIs in one interface, presenting them visually, dynamic, and in real-time, in the dashboard formats. This article will review the best 10 dashboard tools covering different areas, including open source and free software. What Makes a Great Dashboard?

article thumbnail

5 Best Practices to Boost Your Sales Strategy With Data

datapine

Product customization refers to creating a personalized product as per the customer’s requirements. Reports affirm that companies can achieve 40% more ROI by personalizing customer experiences. Short sales cycles thus save time and help companies close more deals, thereby resulting in high ROI and gaining a competitive edge.

Sales 171
article thumbnail

Top 15 Warehouse KPIs & Metrics For Efficient Management 

datapine

3) Top 15 Warehouse KPIs Examples 4) Warehouse KPI Dashboard Template The use of big data and analytics technologies has become increasingly popular across industries. Every day, more and more businesses realize the value of analyzing their own performance to boost strategies and achieve their goals. 2) Why Do You Need Warehouse KPIs?

Metrics 217