Remove Dashboards Remove OLAP Remove Reporting Remove Visualization
article thumbnail

Bridge the Gap Between Reporting and Data Visualization in Power BI

Jet Global

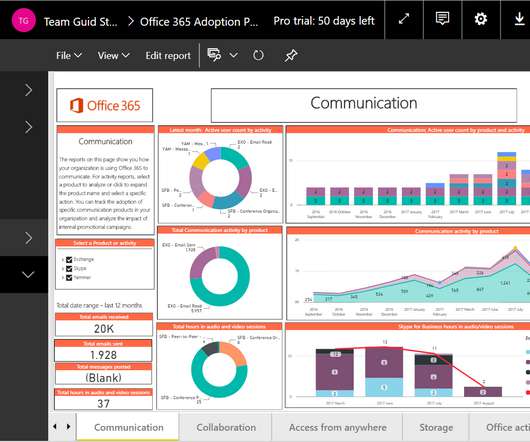
Power BI can generate easy-to-read visualizations that help stakeholders perform key analysis. For Microsoft Dynamics customers this means having up-to-date information in Power BI dashboards and the skills to make custom changes when required. Build critical reports and dashboards without relying on IT.

article thumbnail

Reporting Analytics vs. Financial Reporting: Is There a Difference?

Jet Global

The terms “reporting” and “analytics” are often used interchangeably. In fact there are some very important differences between the two, and understanding those distinctions can go a long way toward helping your organization make best use of both financial reporting and analytics. Financial Reporting.

Insiders

Sign Up for our Newsletter

This site is protected by reCAPTCHA and the Google Privacy Policy and Terms of Service apply.

Trending Sources

article thumbnail

TIBCO JasperSoft for BI and Reporting

BizAcuity

TIBCO Jaspersoft offers a complete BI suite that includes reporting, online analytical processing (OLAP), visual analytics , and data integration. The web-scale platform enables users to share interactive dashboards and data from a single page with individuals across the enterprise. Online Analytical Processing (OLAP).

article thumbnail

What is business intelligence? Transforming data into business insights

CIO Business Intelligence

BI tools access and analyze data sets and present analytical findings in reports, summaries, dashboards, graphs, charts, and maps to provide users with detailed intelligence about the state of the business. Business intelligence examples Reporting is a central facet of BI and the dashboard is perhaps the archetypical BI tool.

article thumbnail

Best Reporting Tools List You Can’t Miss in 2020

FineReport

Reporting tools play vital importance in transforming data into visual graphs and charts, presenting data in an attractive and intuitive manner. An excellent reporting tool will let you gather information conveniently and to have a comprehensive view of your business. Reporting Tools VS BI Reporting . FineReport.

article thumbnail

Reporting System: Everything You Need to Know

FineReport

When mentioning the reporting, folders loaded with spreadsheets, graphs, and commentaries may ring a bell. With the development of enterprise informatization, there are more and more kinds of data produced, and the demand for reports surges day by day. What is the Reporting System? Software to Build Reporting System.

article thumbnail

A Complete Guide For BI Reporting

FineReport

What is BI Reporting? . Business Intelligence is commonly divided into four different types: reporting, analysis, monitoring, and prediction. BI reporting is often called reporting. In other words, you can view BI reporting as various styles+ dynamic data. . BI Reports can vary in their interactivity.