article thumbnail

Extend Power BI with Custom Visuals

Jet Global

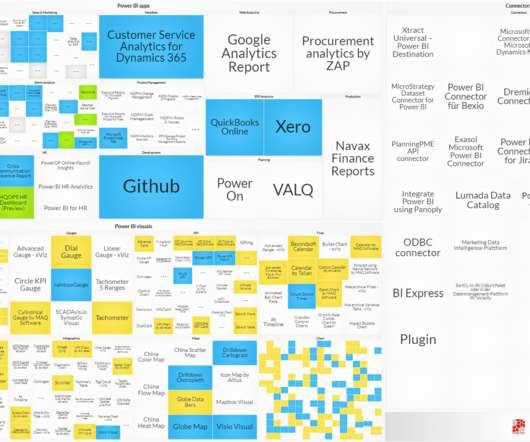
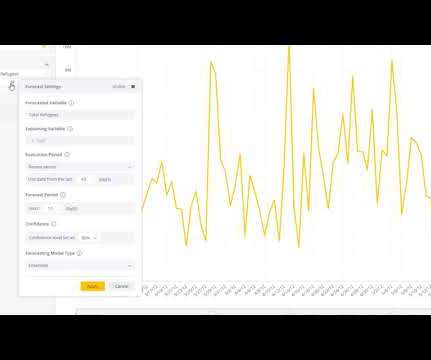
As one of the most widely used data visualization tools in the world, Power BI has made some huge improvements to creating custom visualizations that we want to share with you. When creating or editing a Power BI dashboard, you have access to a ton of different types of visuals. Custom Visuals for Power BI.

article thumbnail

7 Data Visualization Tools to Create Infographics

FineReport

And in this article, I will show you 13 data visualization tools that can help you make infographics in just 30 minutes. Most Popular Data Visualization Examples of Infographics. Many courses that teach students to make infographics by some data visualization tools. 7 Data Visualization Tools that You Need to Know ….

Insiders

Sign Up for our Newsletter

This site is protected by reCAPTCHA and the Google Privacy Policy and Terms of Service apply.

Trending Sources

article thumbnail

The Art and Science of FP&A Storytelling

Timo Elliott

With advanced analytics, flexible dashboarding and effective data visualization, FP&A storytelling has become both an art and science. You can watch the webinar here (registration required) to learn how to conduct FP&A storytelling in order to enhance fact-based decision making. First, because uncertainty exploded.

article thumbnail

Cash Flow Analysis, Cash Management Has Never Been so Vital

Jet Global

Not only will you be able to design your own reports and dashboards that will show exactly how your cash flow is at that point in time, but you will also be able to drill down for easy data validation. To learn more join us on June 17 for this free 20 minute webinar,“ Cash Flow Analysis: Cash Management Has Never Been So Critical.”

article thumbnail

Inform Your 2021 By Looking At the Most Popular Finance Content of 2020

Jet Global

Alongside this, many businesses implemented dashboards to keep track of key financial KPIs on a more regular basis. These enable them to have a visual view of what’s going on, for quicker understanding. How to Build a Free Cash Flow Dashboard, with Downloadable Template. The Best of 2020: Dashboards and Key Metrics.

Finance 105
article thumbnail

The top 15 big data and data analytics certifications

CIO Business Intelligence

Organization: INFORMS Price: US$200 for INFORMS members; US$300 for nonmembers How to prepare: A list of study courses and a series of webinars are available through registration. Candidates show facility with data concepts and environments; data mining; data analysis; data governance, quality, and controls; and visualization.

Big Data 125
article thumbnail

Ultimate List of CFO Blogs and Resources – 2023 Edition

Jet Global

Blogs Podcasts Whitepapers and Guides Tools and Calculators Webinars Sample Reports The Evolution of the CFO into the Chief Data Storyteller View Insight Now Our Favorite CFO Blogs The Venture CFO Blog Link: [link] Are you looking for blog posts for CFOs by CFOs? Check out a sample report from our dynamic dashboard solution.

KPI 105