Remove Data Collection Remove IT Remove Metrics Remove Slice and Dice
article thumbnail

It's Not The Ink, It's The Think: 6 Effective Data Visualization Strategies

Occam's Razor

Ten years, and the 944,357 words, are proof that I love purposeful data, collecting it, pouring smart strategies into analyzing it, and using the insights identified to transform organizations. The end result in all these cases is that data efforts come to naught. Let's go, and have some sexy data presentation fun!

article thumbnail

The Complete Digital Analytics Ecosystem: How To Win Big

Occam's Razor

I led a discussion the other day with a collection of people who were brand new to the space and some who were jaded long-term residents of Camp Web Analytics. I led a discussion the other day with a collection of people who were brand new to the space and some who were jaded long-term residents of Camp Web Analytics. Let's go!

Analytics 150
Insiders

Sign Up for our Newsletter

This site is protected by reCAPTCHA and the Google Privacy Policy and Terms of Service apply.

Trending Sources

article thumbnail

Ten Hidden Gems In Google Analytics: Do Smarter Web Data Analysis!

Occam's Razor

And, that's not all, when you consider that it is segmented data, across multiple dimensions, it really is impressive. But, I'm a big believer in optimizing data access to be at the right time as defined by your decision-making/action-taking speeds inside your company. You can see what's happening right now.

Analytics 155
article thumbnail

Web Analytics 101: Definitions: Goals, Metrics, KPIs, Dimensions, Targets

Occam's Razor

"What is the difference between a metric and a key performance indicator (KPI)?" " "Are goals metrics?" There seems to be genuine confusion about the simplest, most foundational, parts of web metrics / analytics. Metric: A metric is a number. " "What is a dimension in analytics?"

Metrics 138
article thumbnail

Measuring Validity and Reliability of Human Ratings

The Unofficial Google Data Science Blog

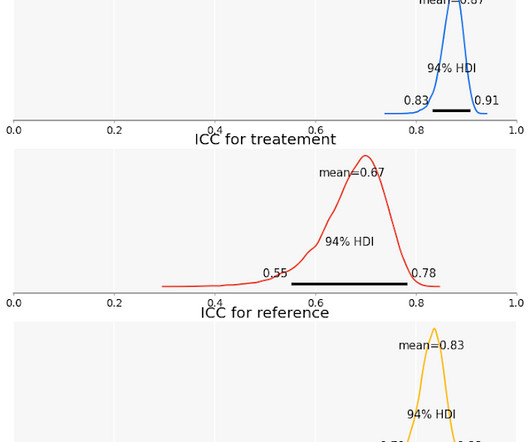
Overview Human-labeled data is ubiquitous in business and science, and platforms for obtaining data from people have become increasingly common. This post describes a generic framework for understanding the quality of human-labeled data, based around the concepts of reliability and validity. This isn’t a new approach either.

article thumbnail

What AI Means to a Retailer Dedicated to Customer Experience

Birst BI

When the data sets are large, with numerous attributes, users spend a lot of time slicing and dicing for newer insights or apply their original hypotheses to a subset of data. We rely on data and analytics to assist in all three areas. The amount of value is immeasurable.

article thumbnail

Move Beyond Excel, PowerPoint And Static Business Reporting with Powerful Interactive Dashboards

datapine

An interactive dashboard is a data management tool that tracks, analyzes, monitors, and visually displays key business metrics while allowing users to interact with data, enabling them to make well-informed, data-driven, and healthy business decisions. Benefit from amazing interactive dashboards!