Remove Data-driven Remove Key Performance Indicator Remove Modeling Remove Predictive Analytics
article thumbnail

What is Integrated Business Planning (IBP)?

IBM Big Data Hub

By having real-time data at their fingertips, decision-makers can adjust their strategies, allocate resources accordingly, and capitalize on the unexpected spike in demand, ensuring customer satisfaction while maximizing revenue. Data integration and analytics IBP relies on the integration of data from different sources and systems.

article thumbnail

Conversational AI use cases for enterprises

IBM Big Data Hub

DL models can improve over time through further training and exposure to more data. When a user sends a message, the system uses NLP to parse and understand the input, often by using DL models to grasp the nuances and intent. DL, a subset of ML, excels at understanding context and generating human-like responses.

Insiders

Sign Up for our Newsletter

This site is protected by reCAPTCHA and the Google Privacy Policy and Terms of Service apply.

Trending Sources

article thumbnail

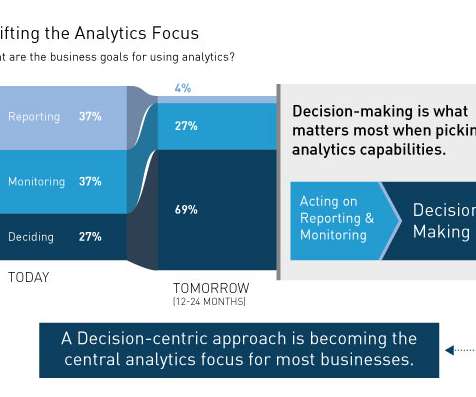
The Purpose of Analytics is not Reporting or Monitoring but Deciding

Decision Management Solutions

The research looked at the increasingly broad portfolio of analytic capabilities available to enterprises – everything from traditional Business Intelligence (BI) capabilities like reporting and ad-hoc queries to modern visualization and data discovery capabilities as well as advanced (predictive) analytics.

Reporting 134
article thumbnail

AI+BI: Augmented analytics will soon bring data-driven insight to the masses

Birst BI

If you’re a business intelligence (BI) and analytics application user, it’s likely that “data-driven insight to the masses” will soon be top-of-mind. Machine learning will transform BI and analytics. Some data discovery vendors tout that they already deliver “self-service to the masses,” but that’s a dubious claim.

article thumbnail

A Guide To Starting A Career In Business Intelligence & The BI Skills You Need

datapine

Does data excite, inspire, or even amaze you? Moreover, companies that use BI analytics are five times more likely to make swifter, more informed decisions. With analytical and business intelligence competencies, you can also choose to work with specific types of firms or companies operating within a particular niche or industry.

article thumbnail

Mastering BI Dashboard Tools: Your Essential Guide

FineReport

In today’s data-driven landscape, businesses are leaning more on BI tools , particularly BI dashboard solutions, to enhance decision-making through data visualization. These BI Dashboard tools blend advanced analytics with user-friendly interfaces, revealing invaluable insights.

article thumbnail

What is Data Visualization: Complete Guide 2024

FineReport

What is Data Visualization Understanding the Concept Data visualization, in simple terms, refers to the presentation of data in a visual format. By utilizing visual elements, data visualization allows individuals to grasp difficult concepts or identify new patterns within the data.