article thumbnail

How OLAP and AI can enable better business

IBM Big Data Hub

Online analytical processing (OLAP) database systems and artificial intelligence (AI) complement each other and can help enhance data analysis and decision-making when used in tandem. Early OLAP systems were separate, specialized databases with unique data storage structures and query languages.

OLAP 59
article thumbnail

6 Principles to Make your Data Story Stick

Juice Analytics

Just as a complex idea won’t stick, too much data also tends to overwhelm your audience. This is the (Juicebox) Way: In contrast to dashboards and reports, data stories focused on specific audiences with simple, clear messages. We’ve made creating a data story as easy as sending an email. Data can make you story concrete.

Insiders

Sign Up for our Newsletter

This site is protected by reCAPTCHA and the Google Privacy Policy and Terms of Service apply.

Trending Sources

article thumbnail

13 power tips for Microsoft Power BI

CIO Business Intelligence

Power BI is Microsoft’s interactive data visualization and analytics tool for business intelligence (BI). With Power BI, you can pull data from almost any data source and create dashboards that track the metrics you care about the most. Power BI’s rich reports or dashboards can be embedded into reporting portals you already use.

article thumbnail

Sisense’s Q2 Release: A Modern Data Experience Across the Analytics Continuum

Sisense

Sisense News is your home for corporate announcements, new Sisense features, product innovation, and everything we roll out to empower our users to get the most out of their data. Today’s organizations are more data-driven than ever. Delivering maximum flexibility for your data.

article thumbnail

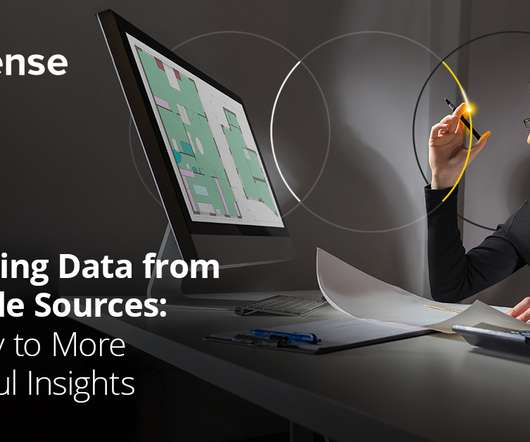
Analyzing Data from Multiple Sources: The Key to More Powerful Insights

Sisense

To get truly powerful insights, you need to pull in data from multiple sources. Additional data sources increase your chances to inform actions, fueling top-line and bottom-line growth. Measuremen: Optimizing facilities use with data from numerous sources. Since those early days, Measuremen has broadened its data sources.

article thumbnail

Data Storytelling: What's Easy and What's Hard

Juice Analytics

Putting data on a screen is easy. Gathering a collection of visualizations and calling it a data story is easy (and inaccurate). Making data-driven narrative that influences people.hard. Making it meaningful is so much harder.

article thumbnail

You Cannot Get to the Moon on a Bike!

Ontotext

In Computer Science, we are trained to use the Okham razor – the simplest model of reality that can get the job done is the best one. Next, I will explain how knowledge graphs help them to get a unified view to data derived from multiple sources and get richer insights in less time. So, they become very data-driven.