article thumbnail

Perform time series forecasting using Amazon Redshift ML and Amazon Forecast

AWS Big Data

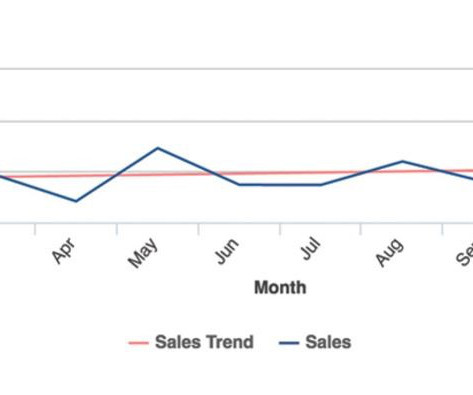
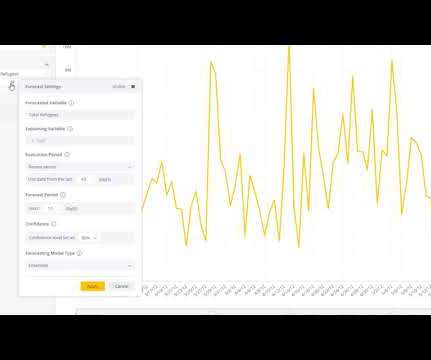
Amazon Redshift is a fully managed, petabyte-scale data warehouse service in the cloud. Tens of thousands of customers use Amazon Redshift to process exabytes of data every day to power their analytics workloads. Forecasting acts as a planning tool to help enterprises prepare for the uncertainty that can occur in the future.

article thumbnail

5 Best Practices for Extracting, Analyzing, and Visualizing Data

Smart Data Collective

However, computerization in the digital age creates massive volumes of data, which has resulted in the formation of several industries, all of which rely on data and its ever-increasing relevance. Data analytics and visualization help with many such use cases. It is the time of big data. Select a Storage Platform.

Insiders

Sign Up for our Newsletter

This site is protected by reCAPTCHA and the Google Privacy Policy and Terms of Service apply.

Trending Sources

article thumbnail

Biggest Trends in Data Visualization Taking Shape in 2022

Smart Data Collective

There are countless examples of big data transforming many different industries. It can be used for something as visual as reducing traffic jams, to personalizing products and services, to improving the experience in multiplayer video games. We would like to talk about data visualization and its role in the big data movement.

article thumbnail

Manage your data warehouse cost allocations with Amazon Redshift Serverless tagging

AWS Big Data

Amazon Redshift Serverless makes it simple to run and scale analytics without having to manage your data warehouse infrastructure. In Cost Explorer, you can visualize daily, monthly, and forecasted spend by combining an array of available filters. The following screenshot shows the preconfigured reports in Cost Explorer.

article thumbnail

Enhance monitoring and debugging for AWS Glue jobs using new job observability metrics, Part 3: Visualization and trend analysis using Amazon QuickSight

AWS Big Data

QuickSight makes it straightforward for business users to visualize data in interactive dashboards and reports. QuickSight periodically runs Amazon Athena queries to load query results to SPICE and then visualize the latest metric data. The filtered Worker Utilization per Job visualization shows 0.5,

Metrics 105
article thumbnail

Bridge the Gap Between Reporting and Data Visualization in Power BI

Jet Global

Business intelligence is a key tool, empowering companies to get the most out of their data by providing tools to analyze information, streamline operations, track performance, and inform decision-making. Power BI can generate easy-to-read visualizations that help stakeholders perform key analysis.

article thumbnail

The Role Of Data Warehousing In Your Business Intelligence Architecture

datapine

BI architecture has emerged to meet those requirements, with data warehousing as the backbone of these processes. One of the BI architecture components is data warehousing. Each of that component has its own purpose that we will discuss in more detail while concentrating on data warehousing. Data integration.