
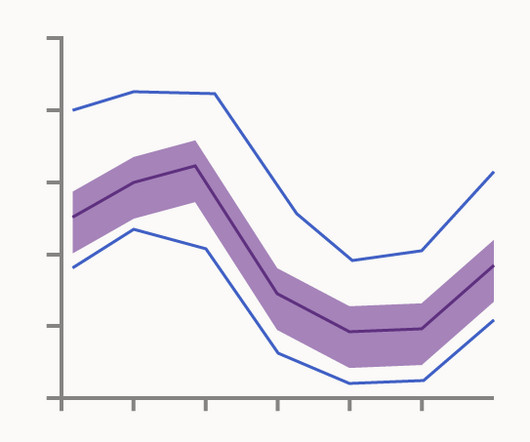
Chart Snapshot: Functional Box Plots
The Data Visualisation Catalogue
APRIL 26, 2024
This allows for the definition of functional quantiles and the identification of central and outlying observations. Genton (2021) [link] Related posts: Further Exploration #5 Multidimensional Boxplot Variations The post Chart Snapshot: Functional Box Plots appeared first on The Data Visualisation Catalogue Blog. and Genton, M.G.,


Let's personalize your content