Remove Download Remove Forecasting Remove Key Performance Indicator Remove Reporting
article thumbnail

30 Best Manufacturing KPIs and Metric Examples for 2021 Reporting

Jet Global

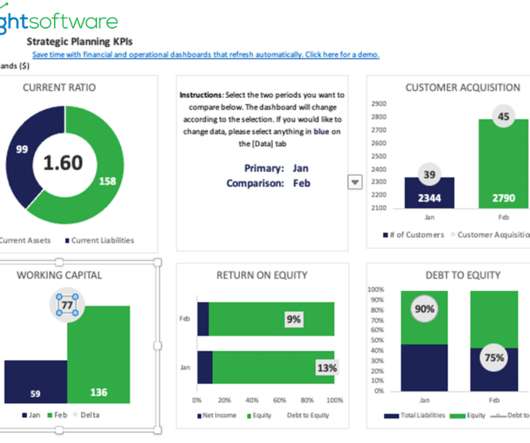
An Operations Key Performance Indicator (KPI) or metric is a discrete measurement that a company uses to monitor and evaluate the efficiency of its day-to-day operations. Whitepaper: How to Compare Reporting & BI Solutions. Download Now. Manufacturing Operational Key Performance Indicators.

Metrics 131
article thumbnail

Guides on Successful Human Resource Reporting

FineReport

Human resource reporting and analysis are the guarantees for doing a good job in human resource monitoring and management. Reasonable human resource reporting allows the HR department to have access to the critical data and key performance indicators of the employees. What is Human Resource Reporting?

Insiders

Sign Up for our Newsletter

This site is protected by reCAPTCHA and the Google Privacy Policy and Terms of Service apply.

Trending Sources

article thumbnail

Improve Financial Accuracy with Tally ERP Analytics!

Smarten

It provides modules to support inventory management, purchasing, sales professionals, accountants, finance managers and other expense and revenue related functions responsible for taxes, statutory reporting etc. These are just a few examples of how businesses can gain insight and provide actionable reporting to improve results.

article thumbnail

6 Steps to Build a Successful BI Strategy Roadmap

FineReport

A business intelligence strategy is a framework that enables enterprises to use the right BI tools to analyze the correct data and then report to the right people to aid in making the right decisions. KPI (Key Performance Indicator)-the indicator you will use to measure performance. Free Download.

article thumbnail

Financial Dashboard: Definition, Examples, and How-tos

FineReport

A financial dashboard, one of the most important types of data dashboards , functions as a business intelligence tool that enables finance and accounting teams to visually represent, monitor, and present financial key performance indicators (KPIs). You can download FineReport for free and have a try!

article thumbnail

Get Started With Business Performance Dashboards – Examples & Templates

datapine

Not to worry – we’ll not only explain the link between big data and business performance but also explore real-life performance dashboard examples and explain why you need one (or several). Exclusive Bonus Content: Stay on top of your business performance! Download our pocket-sized summary and improve your operations!

article thumbnail

Take Advantage Of The Top 16 Sales Graphs And Charts To Boost Your Business

datapine

Download our free executive summary and boost your sales strategy! Let’s examine how you can do so with the following sales KPIs, created for a comprehensive sales report. 2) Sales Target (Actual Revenue vs Forecasted Revenue). Download our free executive summary and boost your sales strategy! From Fiction To Reality.

Sales 235