Remove Download Remove Measurement Remove Metrics Remove Scorecard
article thumbnail

Build Up Your Performance With KPI Scorecards – Examples & Templates

datapine

Tracking the success metrics based on your needs, and the time frame you select while comparing your values can be done with simple yet effective scorecards. Download right here our bite-sized guide and start creating your reports! What Is A KPI Scorecard? The Benefits & Features Of Scorecards.

Scorecard 226
article thumbnail

Ad Block Tracking With Google Analytics: Code, Metrics, Reports

Occam's Razor

I LOVE custom reports [ Five Smart Downloadable Custom Reports ]. And, you can see the all important metric of Conversion Rate. I consider this metric, Per Session Goal Value, to be critical for publishers and hence likely the best one you can use to measure the various implications on you from people's use of ad blockers.

Metrics 103
Insiders

Sign Up for our Newsletter

This site is protected by reCAPTCHA and the Google Privacy Policy and Terms of Service apply.

Trending Sources

article thumbnail

Automating Model Risk Compliance: Model Monitoring

DataRobot Blog

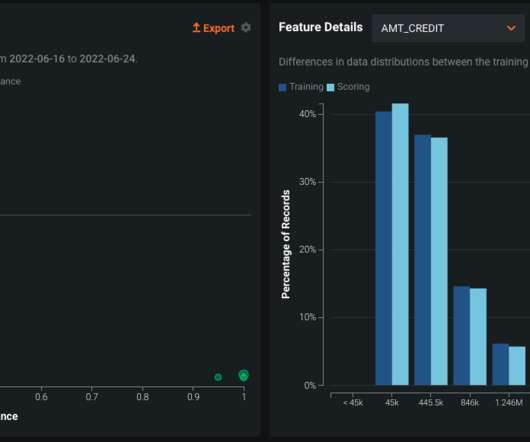
Monitoring Model Metrics. A prerequisite in measuring a deployed model’s evolving performance is to collect both its input data and business outcomes in a deployed setting. Mathematically speaking, data drift measures the shift in the distribution of input values used to train the model.

Risk 59
article thumbnail

Google Analytics Custom Reports: Paid Search Campaigns Analysis

Occam's Razor

If you use Google Analytics then you can download these reports directly into your account and starting having immediate sexy data fun. Never create a custom report without Acquisition, Behavior, Outcome metrics. Be insanely relevant (pick the critical few metrics ). Notice the drill down to Landing Pages from Keyword.

Reporting 127
article thumbnail

Google Analytics Tips: 10 Data Analysis Strategies That Pay Off Big!

Occam's Razor

Bonus: Download the All Traffic Source End to End report for best, in depth, analysis. Download this custom report: Landing Pages Analysis. On top of the graph click on Select A Metric and choose Goal Conversion Rate. Bonus: Download a super awesome all-encompassing mobile custom report: Complete Mobile Performance Report.

Strategy 159
article thumbnail

3 Awesome, Downloadable, Custom Web Analytics Reports

Occam's Razor

In a world where we are overwhelmed with data and metrics and key performance indicators and reports and dashboards and. Not only will I tell you about them, I'll give you downloadable links so you can get going right away! You can use them as is, or, better still, you can download and adapt them to your unique business needs.

Reporting 125
article thumbnail

13 power tips for Microsoft Power BI

CIO Business Intelligence

With Power BI, you can pull data from almost any data source and create dashboards that track the metrics you care about the most. What-if parameters also create calculated measures you can reference elsewhere. Power BI is Microsoft’s interactive data visualization and analytics tool for business intelligence (BI).