Remove Experimentation Remove Key Performance Indicator Remove Metrics Remove Testing
article thumbnail

The Lean Analytics Cycle: Metrics > Hypothesis > Experiment > Act

Occam's Razor

To win in business you need to follow this process: Metrics > Hypothesis > Experiment > Act. We are far too enamored with data collection and reporting the standard metrics we love because others love them because someone else said they were nice so many years ago. That metric is tied to a KPI.

Metrics 156
article thumbnail

Apply Modern CRM Dashboards & Reports Into Your Business – Examples & Templates

datapine

By working with visual key performance indicators (KPIs) and a mix of interactive charts and graphs, you can use a CRM dashboard report to spot trends that will empower you to develop strategies that will build trust as well as brand loyalty on a sustainable basis. Test, tweak, evolve. Work through your narrative.

Insiders

Sign Up for our Newsletter

This site is protected by reCAPTCHA and the Google Privacy Policy and Terms of Service apply.

Trending Sources

article thumbnail

Email Marketing: Campaign Analysis, Metrics, Best Practices

Occam's Razor

You must use metrics that are unique to the medium. Ready for the best email marketing campaign metrics? So for our email campaign analysis let’s look at metrics using that framework. Optimal Acquisition Email Metrics. Allow me to rush and point out that this metric is usually just directionally accurate.

Metrics 137
article thumbnail

6 Case Studies on The Benefits of Business Intelligence And Analytics

datapine

Everything is being tested, and then the campaigns that succeed get more money put into them, while the others aren’t repeated. This methodology of “test, look at the data, adjust” is at the heart and soul of business intelligence. Your Chance: Want to try a professional BI analytics software?

article thumbnail

Analytics On The Bleeding Edge: Transforming Data's Influence

Occam's Razor

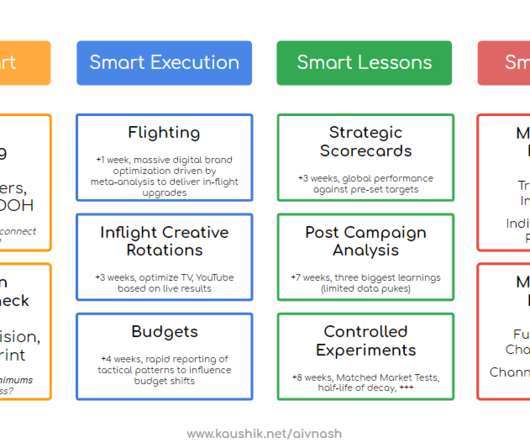
This is very hard to do, we now have a proven seven-step experimentation process, with one of the coolest algorithms to pick matched-markets (normally the kiss of death of any large-scale geo experiment). The first component is a gloriously scaled global creative pre-testing program. Matched market tests. The slow music.

Analytics 131
article thumbnail

Eight Silly Data Things Marketing People Believe That Get Them Fired.

Occam's Razor

Many used some data, but they unfortunately used silly data strategies/metrics. And silly simply because as soon as the strategy/success metric being obsessed about was mentioned, it was clear they would fail. It is a really good metric. But it is not a key performance indicator. I love bounce rate.

Marketing 166
article thumbnail

12 Marketing Reports Examples You Can Use For Annual, Monthly, Weekly And Daily Reporting Practice

datapine

Using the right marketing KPIs (key performance indicators) is a good start – what is now left is finding a way to organize it all in a way that makes sense and brings value. Structure your metrics. That way you can choose the best possible metrics for your case. How do you know that? Regularly monitor your data.

Reporting 280