article thumbnail

Simplify Metrics on Apache Druid With Rill Data and Cloudera

Cloudera

Cloudera has partnered with Rill Data, an expert in metrics at any scale, as Cloudera’s preferred ISV partner to provide technical expertise and support services for Apache Druid customers. As creators and experts in Apache Druid, Rill understands the data store’s importance as the engine for real-time, highly interactive analytics.

Metrics 85
article thumbnail

Move Beyond Excel, PowerPoint And Static Business Reporting with Powerful Interactive Dashboards

datapine

Visualizing the data and interacting on a single screen is no longer a luxury but a business necessity. That’s why we welcome you to the world of interactive dashboards. But before we delve into the bits and pieces of our topic, let’s answer the basic questions: What is an interactive dashboard, and why you need one?

Insiders

Sign Up for our Newsletter

This site is protected by reCAPTCHA and the Google Privacy Policy and Terms of Service apply.

Trending Sources

article thumbnail

13 power tips for Microsoft Power BI

CIO Business Intelligence

Power BI is Microsoft’s interactive data visualization and analytics tool for business intelligence (BI). With Power BI, you can pull data from almost any data source and create dashboards that track the metrics you care about the most. Power BI’s rich reports or dashboards can be embedded into reporting portals you already use.

article thumbnail

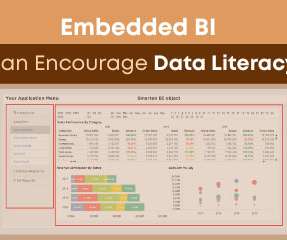
Embedded BI Can Encourage Data Literacy!

Smarten

Embedded BI and Augmented Analytics includes traditional BI components like dashboards, KPIs, Reports with interactive drill-down, drill through, slice and dice and self-serve analytics capabilities.

article thumbnail

How Model Observability Provides a 360° View of Models in Production

DataRobot Blog

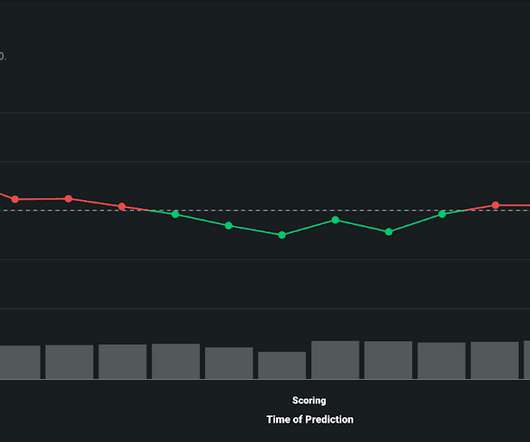
By tracking service, drift, prediction data, training data, and custom metrics, you can keep your models and predictions relevant in a fast-changing world. Model Observability compounds performance stats and metrics across the entire model lifecycle to provide context to problems that can threaten the integrity of your models.

article thumbnail

12 Marketing Reports Examples You Can Use For Annual, Monthly, Weekly And Daily Reporting Practice

datapine

While your keyboard is burning and your fingers try to keep up with your brain and comprehend all the data you’re writing about, using an interactive online data visualization tool to set specific time parameters or goals you’ve been tracking can bring a lot of saved time and, consequently, a lot of saved money. Structure your metrics.

Reporting 280
article thumbnail

Do I Need Both BI Tools and Augmented Analytics?

Smarten

Social BI Tools that allow for sharing of data, alerts, dashboards and interactivity to support decisions, enable online communication and collaboration. Users should have access to stunning visualizations, alerts for exceptions and trends, and deep dive analysis using highly interactive dashboards. Key Performance Indicators (KPIs).