article thumbnail

What is Data Visualization: Complete Guide 2024

FineReport

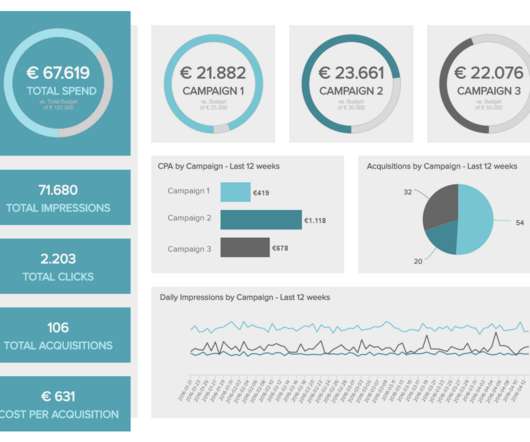
What is Data Visualization Understanding the Concept Data visualization, in simple terms, refers to the presentation of data in a visual format. By utilizing visual elements, data visualization allows individuals to grasp difficult concepts or identify new patterns within the data.

article thumbnail

Mastering Data Visualization Jobs: Your Step-by-Step Career Guide

FineReport

Discovering the World of Data Visualization Jobs In today’s data-driven world, data visualization jobs play a crucial role in transforming complex information into visually appealing and easy-to-understand graphics. But what exactly are data visualization jobs, and why are they important?

Insiders

Sign Up for our Newsletter

This site is protected by reCAPTCHA and the Google Privacy Policy and Terms of Service apply.

Trending Sources

article thumbnail

Data Visualization and Visual Analytics: Seeing the World of Data

Sisense

In a world increasingly dominated by data, users of all kinds are gathering, managing, visualizing, and analyzing data in a wide variety of ways. Data visualization and visual analytics are two terms that come up a lot when new and experienced analytics users alike delve into the world of data in their quest to make smarter decisions.

article thumbnail

The Benefits, Challenges and Risks of Predictive Analytics for Your Application

Jet Global

In this modern, turbulent market, predictive analytics has become a key feature for analytics software customers. Predictive analytics refers to the use of historical data, machine learning, and artificial intelligence to predict what will happen in the future.

article thumbnail

Predictive Analytics in Manufacturing: A Winning Edge

Sisense

In Moving Parts , we explore the unique data and analytics challenges manufacturing companies face every day. Building an accurate predictive analytics model isn’t easy. It’s a difficult process, but an effective predictive analytics engine is an enormous asset for any organization. Big challenges, big rewards.

article thumbnail

5 Benefits of Data Visualization: Why Integrating a Data Catalog is Crucial

Alation

Are you an aspiring data scientist , or just want to understand the benefits of integrating data catalogs with visualization tools? By combining the power of two solutions — data catalogs and data visualization tools — you can get a deeper understanding of your information landscape and create meaningful insights faster.

article thumbnail

Seven Steps to Success for Predictive Analytics in Financial Services

Birst BI

An analytics alternative that goes beyond descriptive analytics is called “Predictive Analytics.”. Predictive Analytics: Predicting Future Outcomes. While descriptive analytics are focused on historical performance, predictive analytics are about predicting future outcomes.