Remove IT Remove Metrics Remove Scorecard Remove Visualization
article thumbnail

Build Up Your Performance With KPI Scorecards – Examples & Templates

datapine

Tracking the success metrics based on your needs, and the time frame you select while comparing your values can be done with simple yet effective scorecards. What Is A KPI Scorecard? A KPI scorecard is a term used to describe a statistical record that measures progress or achievement towards a set performance indicator.

Scorecard 226
article thumbnail

A Beginner’s Guide To Inventory Metrics And Best Practices

datapine

At the same time, inventory metrics are needed to help managers and professionals in reaching established goals, optimizing processes, and increasing business value. Collecting big amounts of data is not the only thing to do; knowing how to process, analyze, and visualize the insights you gain from it is key.

Metrics 286
Insiders

Sign Up for our Newsletter

This site is protected by reCAPTCHA and the Google Privacy Policy and Terms of Service apply.

Trending Sources

article thumbnail

Visualize data quality scores and metrics generated by AWS Glue Data Quality

AWS Big Data

It’s important for business users to be able to see quality scores and metrics to make confident business decisions and debug data quality issues. An operational scorecard is a mechanism used to evaluate and measure the quality of data processed and validated by AWS Glue Data Quality rulesets. An AWS Glue crawler crawls the results.

article thumbnail

Automating Model Risk Compliance: Model Monitoring

DataRobot Blog

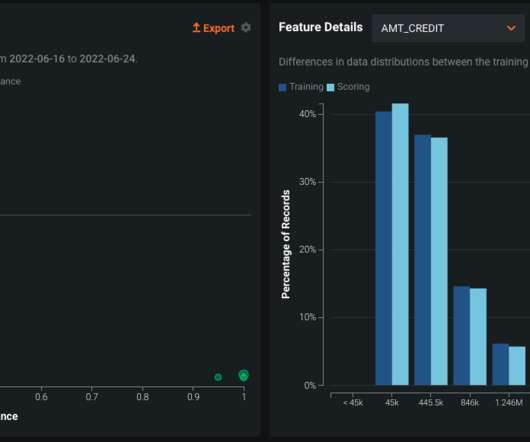
Monitoring Model Metrics. With this data in hand, we are able to measure both the data drift and model performance, both of which are essential metrics in measuring the health of the deployed model. Assumptions used in designing a machine learning model may be quickly violated due to changes in the process being modeled.

Risk 59
article thumbnail

A Complete Guide On How To Set Smart KPI Targets And Goals

datapine

With the help of KPI reports , all of these targets can be visualized together to get a complete picture across departments. In a world where data represents a major competitive advantage for businesses, the need to monitor performance based on specific goals and targets is critical. It is not enough to track relevant customer or sales data.

KPI 152
article thumbnail

A Guide To The Top 14 Types Of Reports With Examples Of When To Use Them

datapine

Let’s see it more in detail with a visual example. A report is a document that presents relevant business information in an organized and understandable format. Each report is aimed at a specific audience and business purpose and it summarizes the performance of different activities based on goals and objectives.

Reporting 201
article thumbnail

13 power tips for Microsoft Power BI

CIO Business Intelligence

Power BI is Microsoft’s interactive data visualization and analytics tool for business intelligence (BI). With Power BI, you can pull data from almost any data source and create dashboards that track the metrics you care about the most. Power BI’s rich reports or dashboards can be embedded into reporting portals you already use.