Remove Key Performance Indicator Remove Metrics Remove Predictive Analytics Remove Statistics
article thumbnail

Smarten Announces SnapShot Anomaly Monitoring Alerts: Powerful Tools for Business Users!

Smarten

Smarten CEO, Kartik Patel says, ‘Smarten SnapShot supports the evolving role of Citizen Data Scientists with interactive tools that allow a business user to gather information, establish metrics and key performance indicators.’

article thumbnail

A Guide To Starting A Career In Business Intelligence & The BI Skills You Need

datapine

According to the US Bureau of Labor Statistics, demand for qualified business intelligence analysts and managers is expected to soar to 14% by 2026, with the overall need for data professionals to climb to 28% by the same year. The Bureau of Labor Statistics also states that in 2015, the annual median salary for BI analysts was $81,320.

Insiders

Sign Up for our Newsletter

This site is protected by reCAPTCHA and the Google Privacy Policy and Terms of Service apply.

Trending Sources

article thumbnail

Data science vs. machine learning: What’s the difference?

IBM Big Data Hub

Areas making up the data science field include mining, statistics, data analytics, data modeling, machine learning modeling and programming. Ultimately, data science is used in defining new business problems that machine learning techniques and statistical analysis can then help solve.

article thumbnail

Get Started With Business Performance Dashboards – Examples & Templates

datapine

The Link Between Data And Business Performance. In today’s information-rich age, there is a tangible link between online data analysis and business performance. It helps to easily spot the overall performance of product lines and adjust the quality, development of new products, and evaluating existing ones. click to enlarge**.

article thumbnail

Analytics On The Bleeding Edge: Transforming Data's Influence

Occam's Razor

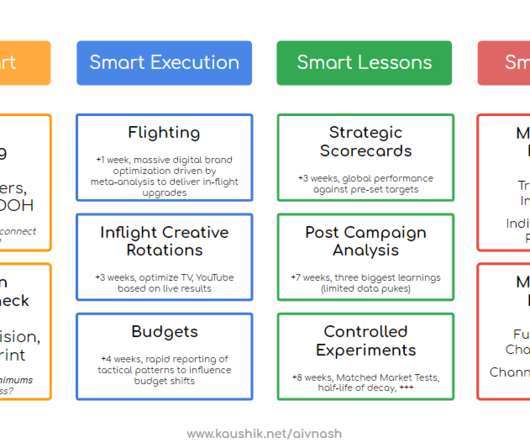
Finally, few analytics teams obsess about predictive analytics in a way that allows them to dictate future action. Underpinning our Smart Lessons work is the very basic – incredibly complex – art of picking the right Key Performance Indicator. The benchmark for the beautiful metric AVOC is 15.3%.

Analytics 131
article thumbnail

A Guide To The Methods, Benefits & Problems of The Interpretation of Data

datapine

Capable of displaying key performance indicators (KPIs) for both quantitative and qualitative data analyses, they are ideal for making the fast-paced and data-driven market decisions that push today’s industry leaders to sustainable success. Business dashboards are the digital age tools for big data.

article thumbnail

Knowledge

Occam's Razor

" ~ Excellent Analytics Tips Series: "What is the best possible advice advice you can give me?" " ~ Web Metrics: "What is a KPI? " + Standard Metrics Revisited Series. Measuring Online Engagement: What Role Does Web Analytics Play? "Engagement" Web Analytics Data Sampling 411.

KPI 124