article thumbnail

Knowledge Graphs and Healthcare

Ontotext

They also developed a large-scale knowledge graph for an early hypothesis testing tool. The knowledge graph seamlessly connects proprietary internal data with open public data to provide a single comprehensive view. Tried and Tested.

article thumbnail

Unlocking the Power of Better Data Science Workflows

Smart Data Collective

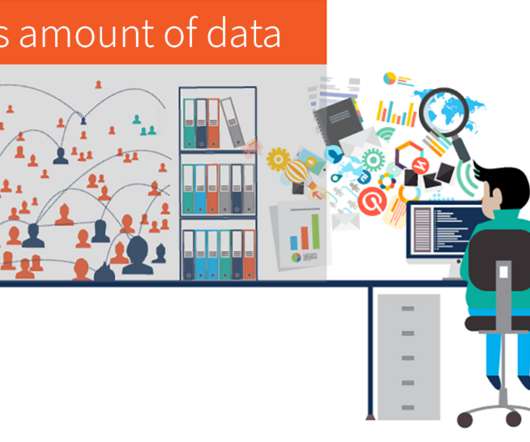
Phase 4: Knowledge Discovery. Algorithms can also be tested to come up with ideal outcomes and possibilities. With the data analyzed and stored in spreadsheets, it’s time to visualize the data so that it can be presented in an effective and persuasive manner. Finally, models are developed to explain the data.

Insiders

Sign Up for our Newsletter

This site is protected by reCAPTCHA and the Google Privacy Policy and Terms of Service apply.

Trending Sources

article thumbnail

Experiment design and modeling for long-term studies in ads

The Unofficial Google Data Science Blog

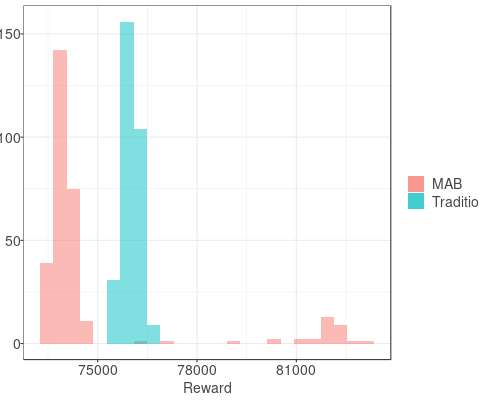
A/B testing is used widely in information technology companies to guide product development and improvements. For questions as disparate as website design and UI, prediction algorithms, or user flows within apps, live traffic tests help developers understand what works well for users and the business, and what doesn’t.

article thumbnail

Changing assignment weights with time-based confounders

The Unofficial Google Data Science Blog

Another reason to use ramp-up is to test if a website's infrastructure can handle deploying a new arm to all of its users. The website wants to make sure they have the infrastructure to handle the feature while testing if engagement increases enough to justify the infrastructure. We offer two examples where this may be the case.

article thumbnail

Designing a SemTech Proof-of-Concept: Get Ready for Our Next Live Online Training

Ontotext

The training is structured to follow the steps of building a simple prototype to test the feasibility of the technology with hands-on guidance by experienced instructors. The answers to these questions are presented in the course of week-long, self-paced sessions and a 4.5-hour hour live online practice session.

article thumbnail

Explaining black-box models using attribute importance, PDPs, and LIME

Domino Data Lab

After forming the X and y variables, we split the data into training and test sets. Next, we pick a sample that we want to get an explanation for, say the first sample from our test dataset (sample id 0). For sample 23 from the test set, the model is leaning towards a bad credit prediction. show_in_notebook(). Ribeiro, M.

Modeling 139
article thumbnail

Performing Non-Compartmental Analysis with Julia and Pumas AI

Domino Data Lab

Once all packages have been imported, we can move on to loading our test data. We can then proceed with pharmacokinetic modeling, testing the goodness of fit of various models. Note that the import may take a while due to the nature of the just-ahead-of-time (JAOT) compiler that Julia uses. Non Compartmental Analysis.

Metrics 59