Remove Metrics Remove Presentation Remove Snapshot Remove Visualization
article thumbnail

How To Present Your Market Research Results And Reports In An Efficient Way

datapine

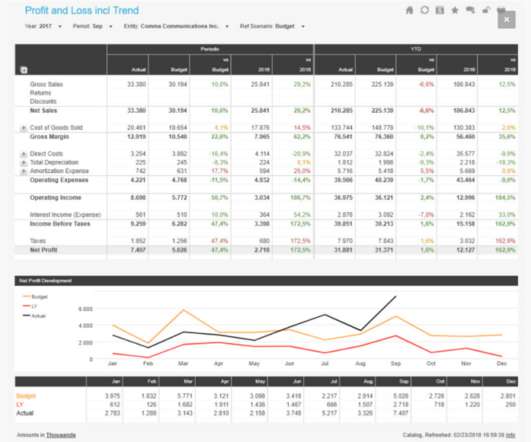
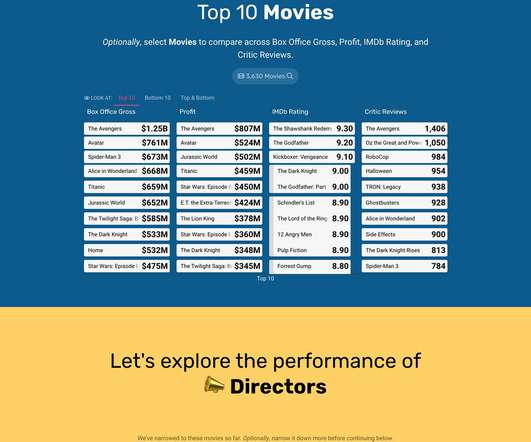
However, today’s business world still lacks a way to present market-based research results in an efficient manner – the static, antiquated nature of PowerPoint makes it a bad choice in the matter, yet it is still widely used to present results. How To Present Your Results: 3 Market Research Example Dashboards.

Reporting 247
article thumbnail

15 Supply Chain Metrics & KPIs You Need For A Successful Business

datapine

That’s why it’s critical to monitor and optimize relevant supply chain metrics. Finally, we will show how to combine those metrics with the help of modern KPI software and create professional supply chain dashboards. Your Chance: Want to visualize & track supply chain metrics with ease?

Metrics 260
Insiders

Sign Up for our Newsletter

This site is protected by reCAPTCHA and the Google Privacy Policy and Terms of Service apply.

Trending Sources

article thumbnail

Why Do You Need To Visualize Your Accounting Reports?

datapine

5) The Role Of Visuals In Accountant Reports. In this article, we will go over the different types of basic accounting reports, why you need them and how you can present them – this last point is crucial in the communication of your financial story, especially when we consider all that is at stake with accountancy. Table of Contents.

article thumbnail

Top 18 Social Media KPIs & Metrics You Should Use For A Complete SM Strategy

datapine

Here, we’ll examine 18 essential KPIs for social media, explore the dynamics and demonstrate the importance of social metrics in the modern business age with the help of a KPI software , and, finally, wrapping up with tips on how to set KPIs and make the most of your social platforms. Let’s get going. What Are Social Media KPIs?

Metrics 219
article thumbnail

7 Data Presentation Tips: Think, Focus, Simplify, Calibrate, Visualize++

Occam's Razor

Data presentation! A vast majority of occasions where data is presented (reports, executive dashboards, conference presentations, or just plain here's a automated emailed thingy from Google Analytics ) end up being abject failures because most of the discussion is still about the data. Ditch the text, visualize the story.

article thumbnail

What Are Business Reports And Why They Are Important: Examples & Templates

datapine

In your daily business, many different aspects and ‘activities’ are constantly changing – sales trends and volume, marketing performance metrics, warehouse operational shifts, or inventory management changes. Now that we know what they are let’s go over some concrete, real-world examples of visuals you will need to include in your reports.

Reporting 297
article thumbnail

Apply Modern CRM Dashboards & Reports Into Your Business – Examples & Templates

datapine

Finally, we will show you a real-life example so you can get a visual overview and a clearer picture of the points discussed in this article. A CRM report, or CRM reporting, is the presentational aspect of customer relationship management. Let’s begin. Your Chance: Want to build professional CRM reports & dashboards?