article thumbnail

Bridge the Gap Between Reporting and Data Visualization in Power BI

Jet Global

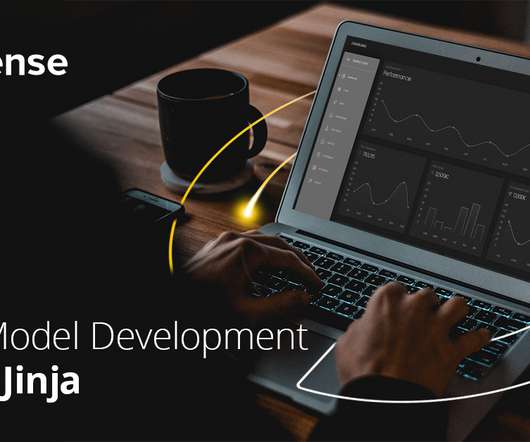
Power BI can generate easy-to-read visualizations that help stakeholders perform key analysis. Jet Analytics from insightsoftware helps bridge the gap between reporting and data visualization. Pre-built OLAP cubes, tabular models, and a data warehouse. Boost refresh times with star schemas, tabular models, and OLAP cubes.

article thumbnail

What is business intelligence? Transforming data into business insights

CIO Business Intelligence

But the benefits of BI extend beyond business decision-making, according to data visualization vendor Tableau , including the following: Data-driven business decisions: The ability to drive business decisions with data is the central benefit of BI.

Insiders

Sign Up for our Newsletter

This site is protected by reCAPTCHA and the Google Privacy Policy and Terms of Service apply.

Trending Sources

article thumbnail

Business Intelligence Solutions: Every Thing You Need to Know

FineReport

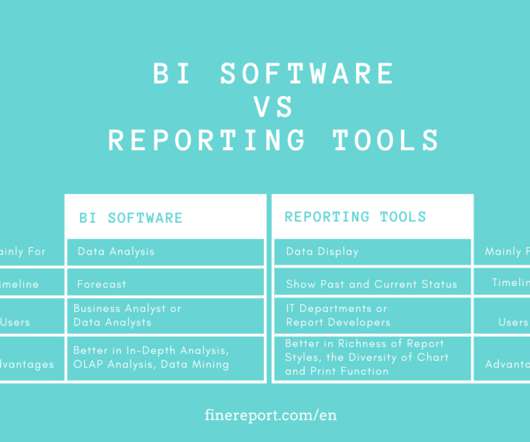
BI software solutions quickly and precisely deliver informative reports and, in the end, fit a solid basis for decision-making over business operations. Technicals such as data warehouse, online analytical processing (OLAP) tools, and data mining are often binding. BI software solutions (by FineReport).

article thumbnail

What are decision support systems? Sifting data for better business decisions

CIO Business Intelligence

They generally leverage simple statistical and analytical tools, but Power notes that some OLAP systems that allow complex analysis of data may be classified as hybrid DSS systems. DSS software system. The software system is built on a model (including decision context and user criteria). DSS database. Parmenides Edios.

article thumbnail

Reporting Analytics vs. Financial Reporting: Is There a Difference?

Jet Global

Multi-dimensional analysis is sometimes referred to as “OLAP”, which stands for “online analytical processing.” Technically speaking, OLAP refers to methodologies for producing multidimensional analysis on high-volume data sets.). That may prompt further investigation and could reveal insights as to the appropriate corrective action.

article thumbnail

TIBCO JasperSoft for BI and Reporting

BizAcuity

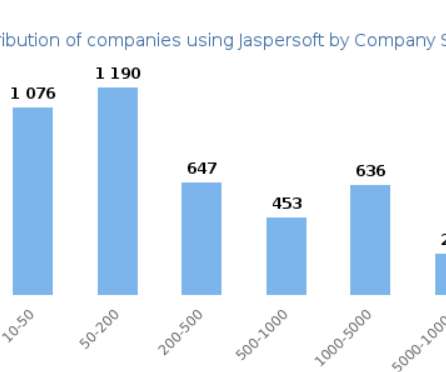
TIBCO Jaspersoft offers a complete BI suite that includes reporting, online analytical processing (OLAP), visual analytics , and data integration. Online Analytical Processing (OLAP). Good Visualization Options. Insights can also be shared externally with a single click. Source: [link] ]. Source: [link] ]. Data Security.

article thumbnail

Top 10 Free and Open Source BI Tools in 2020

FineReport

Although compared to the paid version, not all free BI tool provides stunning data visualization; they offer easy-to-understand charts that can meet your basic needs. Another distinct trait of this software is its feature of data entry. The other prominent features of this software include, Open APIs for customization.

OLAP 105