article thumbnail

Biggest Trends in Data Visualization Taking Shape in 2022

Smart Data Collective

It can be used for something as visual as reducing traffic jams, to personalizing products and services, to improving the experience in multiplayer video games. We would like to talk about data visualization and its role in the big data movement. Data is useless without the opportunity to visualize what we are looking for.

article thumbnail

Mindshare Integrates Predictive Analytics to Deliver Performance Marketing at Scale

DataRobot Blog

In a world that is increasingly outcome-focused and platform-based, we have integrated strategy and predictive analytics to move at the speed of our clients’ decisions and established a scalable framework for uncovering and acting on insights in an organized, simple, and transparent operating model.

Insiders

Sign Up for our Newsletter

This site is protected by reCAPTCHA and the Google Privacy Policy and Terms of Service apply.

Trending Sources

article thumbnail

Predictive Analytics World 2019 – What I Learned and What I Said

Decision Management Solutions

We like to use decision modeling on analytic projects precisely for this reason – the decision model represents a visual map of the domain expertise that the analytics team can use to frame their work. If you haven’t been to Predictive Analytics World, or if it has been a few years, plan to go next year!

article thumbnail

6 Case Studies on The Benefits of Business Intelligence And Analytics

datapine

Because things are changing and becoming more competitive in every sector of business, the benefits of business intelligence and proper use of data analytics are key to outperforming the competition. 5) Find improvement opportunities through predictions. Your Chance: Want to try a professional BI analytics software?

article thumbnail

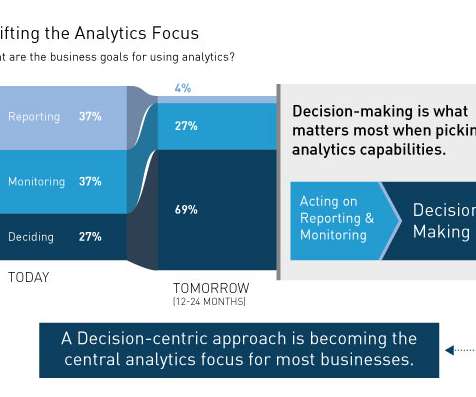
The Purpose of Analytics is not Reporting or Monitoring but Deciding

Decision Management Solutions

The research looked at the increasingly broad portfolio of analytic capabilities available to enterprises – everything from traditional Business Intelligence (BI) capabilities like reporting and ad-hoc queries to modern visualization and data discovery capabilities as well as advanced (predictive) analytics.

Reporting 134
article thumbnail

A Guide To The Methods, Benefits & Problems of The Interpretation of Data

datapine

Through the art of streamlined visual communication, data dashboards permit businesses to engage in real-time and informed decision-making and are key instruments in data interpretation. Typically, quantitative data is measured by visually presenting correlation tests between two or more variables of significance.

article thumbnail

Your Guide To Modern Agency Analytics, Dashboards & Reporting Techniques

datapine

By using online data visualization tools such as interactive dashboards you can tell a story with your data and extract advanced insights to support your work when presenting it to clients. This type of agency reporting tool enables you to simplify complex analytics processes and make predictions about possible developments in your data.