Remove reports-before-and-after-taking-great-graphs-by-ann-k-emery
article thumbnail

Teaching + Knowledge = Passion for Data Viz

Depict Data Studio

One of the primary reasons for taking Ann’s data visualization course, Great Graphs , was to learn better ways to use Microsoft Excel as a visualization tool. I am so excited to share how grateful I am to Ann and her colleagues for putting together an online training to share their talents with me.

article thumbnail

10+ Tips from an International Dataviz Speaker

Depict Data Studio

After traveling all over the world to provide data visualization training for the past six+ years, I’ve made list of tips from the point of view as an international dataviz speaker. (We I was on a podcast–finally! My friend Jon Schwabish of PolicyViz has asked me to be on his podcast at least ten billion times and I finally agreed.

Insiders

Sign Up for our Newsletter

This site is protected by reCAPTCHA and the Google Privacy Policy and Terms of Service apply.

article thumbnail

Reports Before (So Embarrassing) and After (So Exciting) Taking Great Graphs by Ann K. Emery

Depict Data Studio

Keep up the great work, Christine! –Ann. I do a lot of evaluation work as a consultant, but it’s usually more evaluation training, preparation, and capacity building than it is evaluation report writing. Once every few years, I get a contract for which I have to produce a report. Report style and colour scheme?

article thumbnail

We Sold (Nearly) Everything to Travel the World with Our 2 Kids. Here’s What Happened Next.

Depict Data Studio

My speaking opportunities were taking me all over the world—a dream! Sometimes I’d city-hop, speaking in two, three, or four cities consecutively before heading back home. But after 30 years there, we were both ready for a change. Who doesn’t love the great outdoors?? But, meanwhile, I had a cute kid at home.

article thumbnail

How to Visualize Small n’s with Icon Arrays

Depict Data Studio

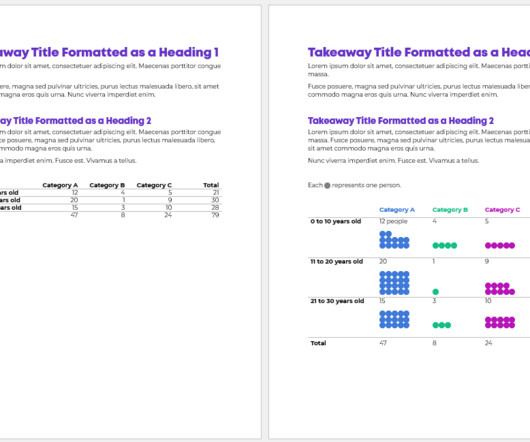
Before: Reading Numbers Her “before” version looked something like this: She had small n’s — a unique situation! After: Skimming Visuals There are several ways to bring the table to life. In other words, I aim for zero or few tables within the body of the report.

article thumbnail

My 6 Data Communications Classes

Depict Data Studio

One class focuses on data analysis (cleaning and tabulating our raw datasets to get them ready for graphs). I call them deep dives because they focus just on reports, or dashboards, or presentations. Three classes are advanced, sort of. Three classes are advanced, sort of. Chances are, there’s a faster and easier way to get it done.