Remove resources can-data-analytics-motivate-a-sales-team-to-perform-better
article thumbnail

KPI Management And Best Practices: How To Find The Perfect KPI Solutions?

datapine

4) How to Select Your KPIs 5) Avoid These KPI Mistakes 6) How To Choose A KPI Management Solution 7) KPI Management Examples Fact: 100% of statistics strategically placed at the top of blog posts are a direct result of people studying the dynamics of Key Performance Indicators, or KPIs. 3) What Are KPI Best Practices?

KPI 221
article thumbnail

Discover The Power Of Modern Performance Reports – See Examples & Best Practices 

datapine

Table of Contents 1) What Is A Performance Report? 2) The Importance of Performance Reports 3) Performance Report Examples 4) Performance Reporting Tips Performance reporting has been a traditional business practice for decades now. What Is A Performance Report?

Reporting 207
Insiders

Sign Up for our Newsletter

This site is protected by reCAPTCHA and the Google Privacy Policy and Terms of Service apply.

article thumbnail

Discover Powerful Small Business Dashboards & KPIs To Track For Success

datapine

The times were data analysis was segregated to big enterprises that had the necessary resources to carry it out are long gone. Today, thanks to the rise of self-service BI tools, the analytical doors have been opened to a wider audience. Explore our 14-days free trial & start making data-driven decisions today!

article thumbnail

Get Started With Interactive Weekly Reports For Performance Tracking

datapine

4) Top Elements Of A Weekly Performance Report. Businesses have been analyzing their performance for decades through traditional written reports, but with the amount of data being produced every day, the need for more frequent reporting is growing. Table of Contents. 1) What Is A Weekly Report? What Is A Weekly Report?

article thumbnail

A Complete Guide To Spider Charts With Best Practices And Examples Of When To Use Them 

datapine

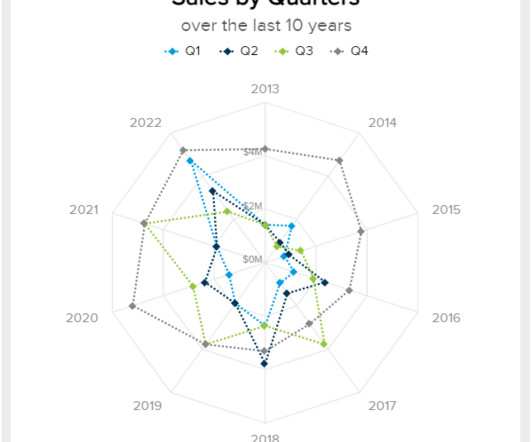
2) When To Use Spider Graphs 3) Types Of Radar Charts 4) Radar Graph Best Practices 5) Spider Chart Examples If you are reading this blog post then you must be somewhat aware of the value of data visualization. As the image above shows, these graphs use a node (anchor) and equiangular spokes (axis) to represent each data dimension.

article thumbnail

Monthly Reports Templates & Examples To Monitor Business Performance

datapine

From startups to big enterprises, businesses are collecting more and more data every day and, it is no secret, that whoever is not taking advantage of it will simply stay behind. A monthly report is a data analysis tool that provides a summary of the performance of several business processes. Table of Contents.

Reporting 211
article thumbnail

A Guide To The Top 14 Types Of Reports With Examples Of When To Use Them

datapine

No matter what role or industry you work in, chances are that you have been faced with the task of generating a tedious report to show your progress or performance. This presents a problem for many modern organizations today as building reports can take from hours to days. Table of Contents 1) What Is The Report Definition?

Reporting 201