article thumbnail

Smarten Announces SnapShot Anomaly Monitoring Alerts: Powerful Tools for Business Users!

Smarten

Smarten announces the launch of SnapShot Anomaly Monitoring Alerts for Smarten Augmented Analytics. SnapShot Monitoring provides powerful data analytical features that reveal trends and anomalies and allow the enterprise to map targets and adapt to changing markets with clear, prescribed actions for continuous improvement.

article thumbnail

End-to-end development lifecycle for data engineers to build a data integration pipeline using AWS Glue

AWS Big Data

The following are common asks from our customers: Is it possible to develop and test AWS Glue data integration jobs on my local laptop? The software development lifecycle on AWS defines the following six phases: Plan, Design, Implement, Test, Deploy, and Maintain. Test In the testing phase, you check the implementation for bugs.

Insiders

Sign Up for our Newsletter

This site is protected by reCAPTCHA and the Google Privacy Policy and Terms of Service apply.

Trending Sources

article thumbnail

Your Definitive Guide To KPI Tracking By Utilizing Modern Software & Tools

datapine

Your Chance: Want to test a professional KPI tracking software for free? By selecting the right KPIs for various areas of the business, it’s possible to use them to arrange as well as visualize large datasets. Communication: KPI reports and trackers are visual and interactive, which means that they are incredibly inclusive.

KPI 195
article thumbnail

Top 10 Management Reporting Best Practices To Create Effective Reports

datapine

When these reports are backed up with powerful visualizations developed with a dashboard creator , no information can stay hidden, eliminating thus the possibility of human errors and negative business impact. 4) Make your report visually pleasing through focus. 7) Strike a balance with your data visualizations.
Reporting 263
article thumbnail

10 Examples of How Big Data in Logistics Can Transform The Supply Chain

datapine

Using the right dashboard and data visualizations, it’s possible to hone in on any trends or patterns that uncover inefficiencies within your processes. Your Chance: Want to test a professional logistics analytics software? Your Chance: Want to test a professional logistics analytics software?

Big Data 275
article thumbnail

How to Create a Simple Visual Style Guide WITHOUT a Designer!

Depict Data Studio

We have found that a great starting point is a do-it-yourself visual style guide – which can be developed with very few resources. This tool also allows you to test for color blindness test to ensure accessibility of selected colors. Photos are a powerful and compelling visual tool. What is a Style Guide?

article thumbnail

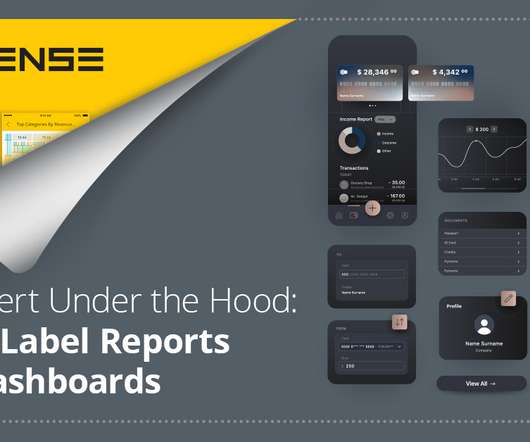
An Expert Under the Hood: White-Label Reports and Dashboards

Sisense

What are white-labeled reports White-label reports: Under the hood Exploring white-label dashboards Use case snapshots Horsepower under the hood. Data-Powered Apps delves into how product teams are infusing insights into applications and services to build products that will delight users and stand the test of time.