Remove tracks data-visualization-with-r
article thumbnail

Chart Snapshot: Area Bands

The Data Visualisation Catalogue

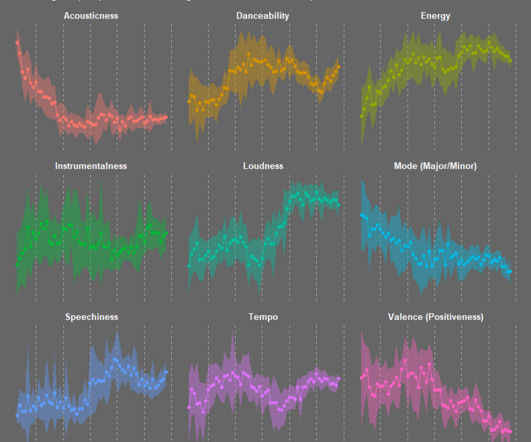
Area Bands enhance standard Line Graphs by filling the space between upper and lower value lines with a shaded area, providing a visual representation of the range boundaries. Essentially, this is a visual enhancement to a graph, which offers more detail and context to data changing over time.

article thumbnail

Accelerating Drug Discovery and Development with DataOps

DataKitchen

If a company can use data to identify compounds more quickly and accelerate the development process, it can monetize its drug pipeline more effectively. DataOps automation provides a way to boost innovation and improve collaboration related to data in pharmaceutical research and development (R&D).

Testing 246
Insiders

Sign Up for our Newsletter

This site is protected by reCAPTCHA and the Google Privacy Policy and Terms of Service apply.

article thumbnail

12 data science certifications that will pay off

CIO Business Intelligence

Data scientist is one of the hottest jobs in IT. Companies are increasingly eager to hire data professionals who can make sense of the wide array of data the business collects. According to data from PayScale, $99,842 is the average base salary for a data scientist in 2024.

article thumbnail

Enhance monitoring and debugging for AWS Glue jobs using new job observability metrics, Part 3: Visualization and trend analysis using Amazon QuickSight

AWS Big Data

QuickSight makes it straightforward for business users to visualize data in interactive dashboards and reports. You can slice data by different dimensions like job name, see anomalies, and share reports securely across your organization. CloudWatch streams metric data through a metric stream into Amazon Data Firehose.

Metrics 103
article thumbnail

Essential data science tools for elevating your analytics operations

CIO Business Intelligence

The boom in data science continues unabated. The work of gathering and analyzing data was once just for a few scientists back in the lab. Now every enterprise wants to use the power of data science to streamline their organizations and make customers happy. The world of data science tools is growing to support this demand.

article thumbnail

Data Science Tools: Understanding the Multiverse

Domino Data Lab

In the multiverse of data science, the tool options continue to expand and evolve. While there are certainly engineers and scientists who may be entrenched in one camp or another (the R camp vs. Python, for example, or SAS vs. MATLAB), there has been a growing trend towards dispersion of data science tools. Data Languages.

article thumbnail

DataOps Facilitates Remote Work

DataKitchen

Remote working has revealed the inconsistency and fragility of workflow processes in many data organizations. The data teams share a common objective; to create analytics for the (internal or external) customer. Data Science Workflow – Kubeflow, Python, R. Data Engineering Workflow – Airflow, ETL.

Testing 147