Remove try-juicebox
article thumbnail

10 Tips to Visualize Data Like a Pro

Juice Analytics

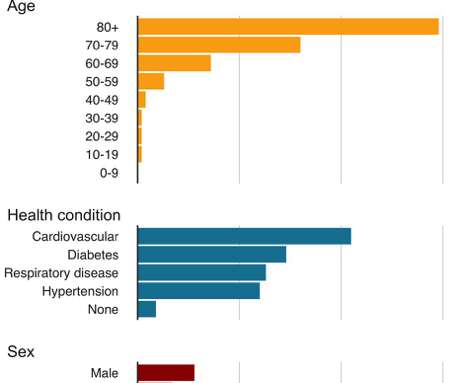
In Juicebox , we encourage using 3-significant digits so that. Expert data visualizers try to always display labels horizontally for easy reading and give them sufficient space so they don’t end up shrunk to small font sizes. It is the subtle bits that we try to build into Juicebox so you can look like a pro when you present data.
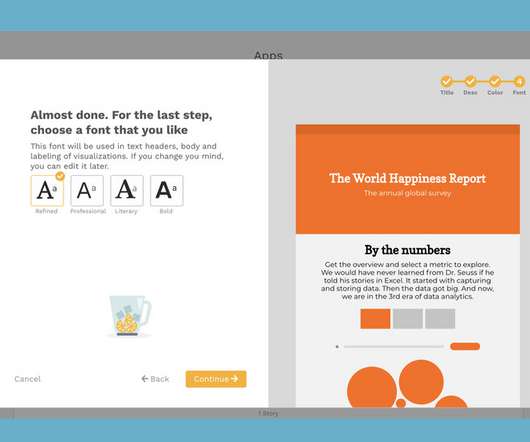
article thumbnail

Making a Leaderboard Visualization in Juicebox

Juice Analytics

We designed Juicebox to be the easiest way to present your data. I want to show you how easy that is to do in Juicebox. I want to show you how easy that is to do in Juicebox. This video tutorial will take you through the process of creating a Juicebox leaderboard in less than 5 minutes. Try Juicebox free.

Insiders

Sign Up for our Newsletter

This site is protected by reCAPTCHA and the Google Privacy Policy and Terms of Service apply.

article thumbnail

Making a Dynamic Bar Chart in Juicebox

Juice Analytics

We designed Juicebox to be the easiest way to present your data. I want to show you how easy that is to do in Juicebox. This video tutorial will take you through the process of creating a Juicebox dashboard in less than 5 minutes. Try Juicebox Free. The finished application can be accessed here: [link].

article thumbnail

The Unexpected Value of Data Storytelling in Sales Presentations

Juice Analytics

It isn’t about trying to overwhelm your prospect with hard, numbers-based evidence of the value of your product. We work with sales leaders all the time who are discovering how data storytelling can improve their sales conversations: One of our Juicebox clients sells complex education and talent management solutions.

Sales 140
article thumbnail

Why Your Data Presentation Solution Needs to Be Fast

Juice Analytics

We created Juicebox to serve the citizen data analyst. Like when I try to play a game on Xbox. But if it is easy to try-try-again, you can fail fast. With Juicebox , we can create a prototype in minutes and start gathering real feedback immediately. Try Juicebox Free.

article thumbnail

Lessons in Data Storytelling: Relatable and Specific

Juice Analytics

In the following interactive Juicebox learning app , we share examples of making data relatable and specific. Try Juicebox Free. This is the special sauce that separates data storytelling from traditional dashboards and reports.

article thumbnail

Maker Tools for Information Workers

Juice Analytics

We think it should look a lot more like this: Juicebox is the new maker tool for data presentations. Try Juicebox free. What’s going to make that stuff easy, in the same way that Squarespace made websites easy and Canva is making visual design accessible to anyone? This is not it…. This is not it…. This is not it….

Sales 144