10 June, 2024
17 mins read
17 mins read

Performance tracking has never been easier. With the rise of modern self-service BI tools, everyone can monitor relevant performance indicators in a matter of seconds. But this is not without problems. Having the ability to analyze your data fast and efficiently doesn’t always mean you are doing it correctly. Businesses extract data from several internal and external sources, which makes it difficult but necessary to filter this data and only keep what’s relevant for the company. This is done with the help of KPIs and metrics.
KPIs and metrics are often considered the same thing in day-to-day business contexts. However, while they work similarly, they are not used for the same purposes. Just memorize this statement for later: all KPIs are metrics, but not all metrics are KPIs.
This post will cover the main difference between metrics and KPIs and provide examples and tips for efficient performance tracking.
Let’s kick it off with the answer to the famous question: are metrics and KPIs the same?
Key performance indicators, or KPIs, measure performance or progress based on specific business goals and objectives. A pivotal element to consider is the word “key,” meaning they only track what is truly relevant to the company’s strategic decisions.
A good KPI should help you and your team understand if you are making the right decisions. They act as a map of business outcomes and are the strategic indicators that will move the company forward. Examples of KPIs can be sales growth, customer retention, or customer lifetime value. Companies usually visualize these measurements with the help of interactive KPI reports.
Metrics are quantitative measurements used to track the performance of specific business processes at an operational and tactical level. They help provide context for the performance of key business goals but are not critical to their success like KPIs are.
While some might be tight to objectives, metrics are not the most important indicators for monitoring strategic actions. However, they are still relevant to informing businesses about the progress of their different activities. Some examples of metrics include the lead-to-conversion ratio, return rate, and acquisition costs by marketing channel.
Now that we have a basic understanding of the definitions of both indicators, let’s explore the difference between KPIs and metrics further.
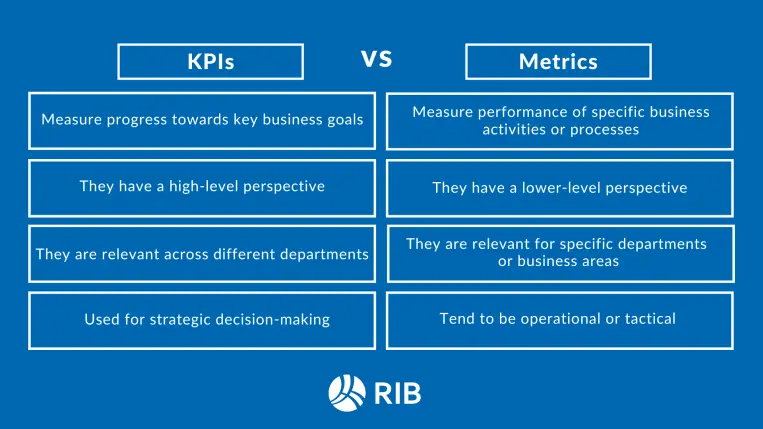
KPIs and metrics are often considered synonyms. But this is not how it actually works. While they are both quantitative measurements, they are used for different purposes. Simply put, KPIs need to be exclusively linked to targets or goals to exist, and metrics just measure the performance of specific business actions or processes. Let’s see some of the differences between the KPI and metrics in more detail.
Let’s put these differences into perspective with some metrics vs KPI examples!
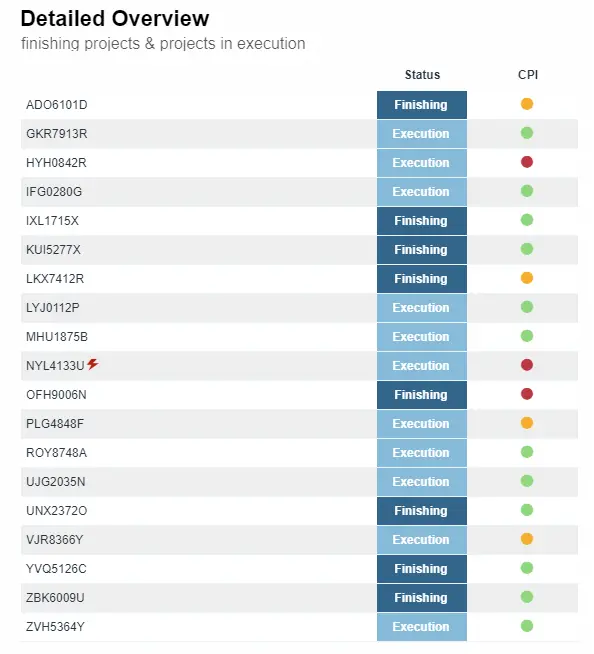
Delivering projects on time and, most importantly, within budget is one of a construction company’s most relevant strategic goals. To do so, project managers must plan and schedule the tasks correctly and anticipate multiple challenges or potential issues to ensure the work is completed on time and with the expected quality. For our first example, we will discuss increasing the cost-efficacy of a company’s construction projects. For this purpose, we will take the CPI as our main KPI. Let’s explore it in more detail below!
The CPI has become one of the most relevant KPIs for assessing project performance. It measures a project’s cost and financial efficiency by comparing the value of the work completed to the actual costs. It is calculated using the following formula: CPI = earned value (EV) / actual cost (AC). A CPI higher than 1 means the project is cost-effective, and a CPI lower than 1 shows the project is over budget. The image below shows a table chart displaying the CPIs of different projects. The colors following each project show the status of the CPI, with green being over 1, yellow being risky, and red being negative.
If you know anything about construction, you know that building projects are never static. Many factors can impact on your CPI. Some are external, such as a rise in material or labor costs, weather conditions, or economic conditions, while others are internal, like overlooked risks, low labor productivity, or mistakes during preconstruction planning and design, which leads us to our metric example.
Reworks are common in construction projects. They refer to any work that needs to be done again or adapted due to a mistake or an unforeseen situation. In most cases, reworks can be avoided with efficient planning and risk management. However, issues with construction communication and collaboration can lead to mistakes in the project’s early stages, which can then impact the following stages.
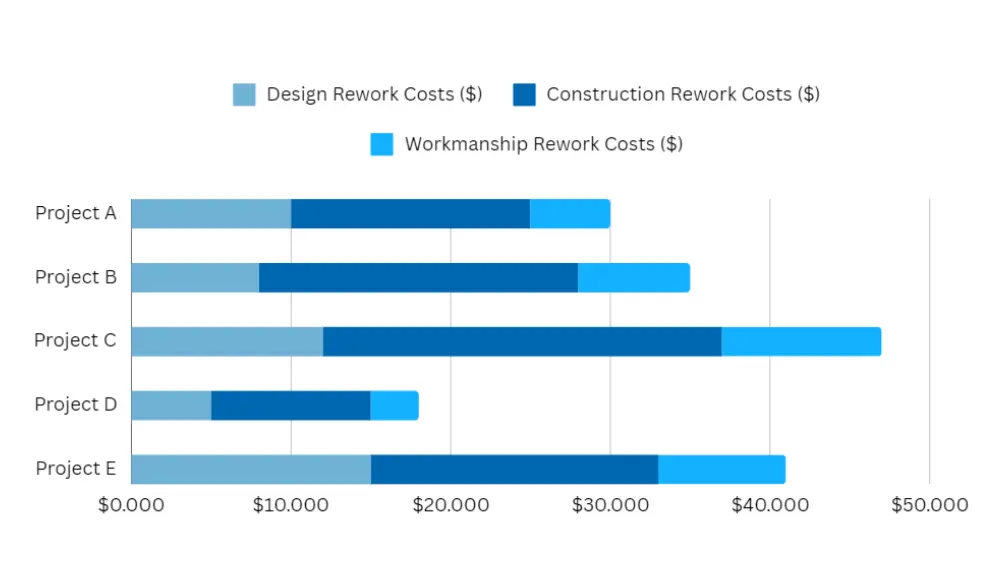
Reworks can directly affect a project’s CPI because they increase costs beyond the budgeted amounts for that specific work, meaning the value earned from that work does not align with its costs. Therefore, tracking it closely is of the utmost importance. In this case, the rework costs are tracked for multiple projects and categories. Project C has the highest rework costs in all categories, meaning issues in design probably affected the rest of the project. This needs to be analyzed further to extract insights and learn from them.
Ensuring the entire supply chain is efficient in logistics and warehouse management is paramount to success. One of the most popular KPIs to measure success is order cycle time, which measures the time it takes a company to ship an order from the moment it was placed until it leaves the warehouse, without considering shipping time. Naturally, businesses want to keep this KPI as low as possible, as it means all areas of the supply chain, including inventory management, picking, and packing, and transportation, are working as expected. Let’s explore this in more detail below.
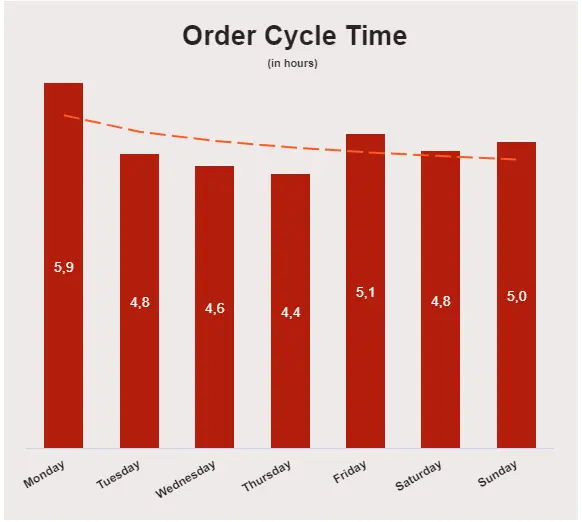
The order cycle time is an important KPI as it can shine a light on other issues in your supply chain. It is used to evaluate the efficiency of fulfillment processes and can significantly influence customer satisfaction. Unlike other KPIs mentioned above, the order cycle time needs to be tracked in shorter periods, such as weekly or daily, as it can be affected by multiple unexpected factors, like an influencer sharing your product and generating an unexpected increase in demand. That said, without considering unexpected events, this KPI can still be optimized by measuring different metrics. Below, we will discuss an example of one.
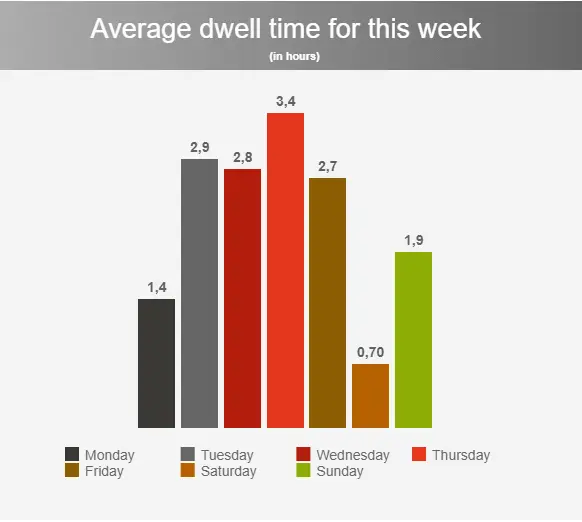
As mentioned above, many processes and people are involved in achieving a successful order cycle time. Therefore, there are several metrics, including picking accuracy, shipping time, equipment utilization, inventory accuracy, and many more, that you can measure to evaluate and optimize your order cycle time in a professional online dashboard. Today, we will focus on dwell time. This metric measures the average number of hours drivers spend in the warehouse waiting for orders to be loaded or unloaded from the trailer. Some of the most common reasons for an increase in dwell time include vehicle delays, loading complex or heavy orders, tedious check-in processes, and order volume, among others.
It is important to mention that having some dwell time is unavoidable and should be considered in your order cycle calculations. However, some of the reasons we just mentioned are easily preventable. Therefore, you should closely monitor the metric to ensure you can spot solvable inefficiencies as soon as possible.
Let’s explore our example of increasing sales by 20% by the end of the year in more detail. A big goal like sales growth is relevant to various departments across a business, such as management, sales, marketing, and production. Each department tracks its own metrics to understand how its activities contribute to the general goal. Here, we will focus on a sales metric vs. KPI example.
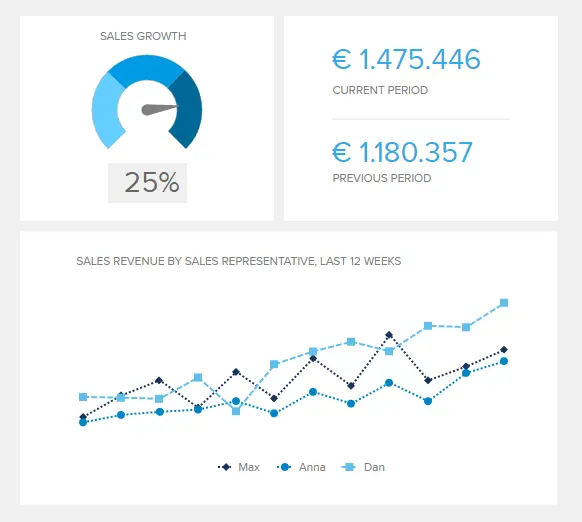
The image above visually represents our main KPI: sales growth. With information such as the current period vs. the previous one, the percentage of sales based on a target, and sales revenue by a sales representative, we can see at a glance if targets are being met or not. But to finetune the strategies, we also need to know how the different activities are performing, which can be done with the help of various sales metrics.
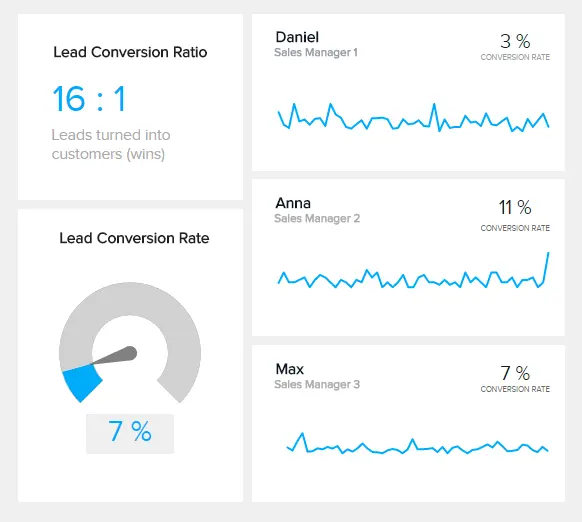
The lead-to-conversion ratio is a great sales metric to measure for this specific goal. It measures the number of interested people who actually end up turning into paying customers. Which eventually translates into an increase in sales. This metric, generated with professional sales reporting software, is helpful as it provides deeper insights to make strategic decisions. If your lead conversion rate is low, you must consider alternatives to motivate potential customers to become actual customers. Other metrics to measure for this goal include the lead-to-opportunity ratio and net profit margin, among others.
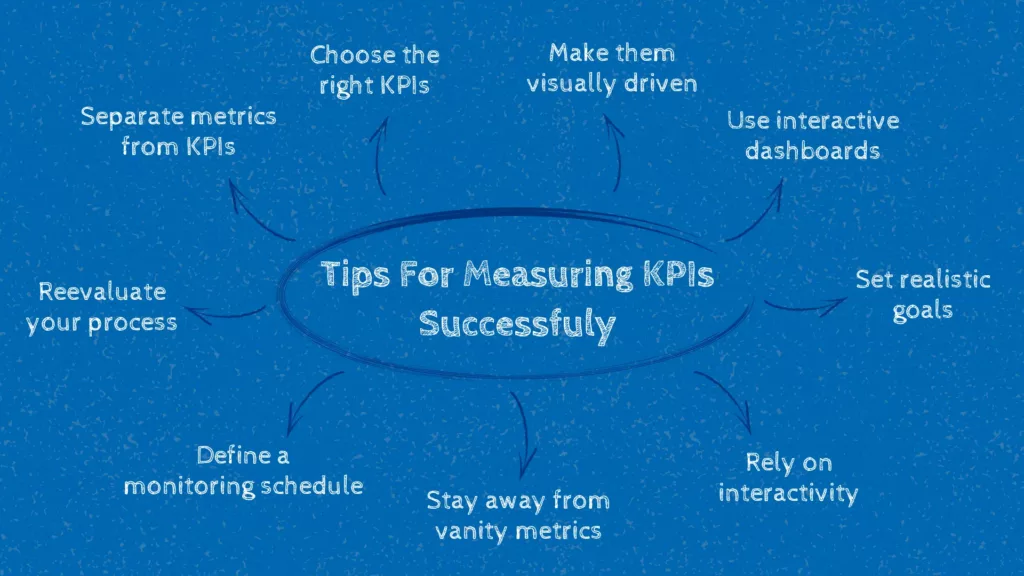
We’ve covered the definition of key performance indicators and metrics and discussed the differences between business metrics vs KPIs. In this section of the post, we will discuss five tips for efficiently measuring your goals and performance.
Measuring everything really means measuring nothing. When separating KPIs from metrics, you must consider what is most important for your business. Any indicator can be a metric, but if it does not provide valuable information to improve, you should discard it.
Tracking the wrong metrics can lead to a waste of time and resources that could be easily avoided. Measuring too much can get confusing and misleading. To prevent this, pick only the KPIs that add value to your goals and leave any unuseful information behind. More on this in the next point.
Choosing the right KPIs to measure is the most important step in tracking your strategies efficiently. To help with this purpose, there are some KPI tracking techniques that you can use. Here, we will explain two of them: the SMARTER and the Six A’s methods.
By applying these methods, you should be able to narrow it down to 2-5 critical KPIs per business goal. This helps you keep your analysis process specific and avoid misleading information that can affect how you interpret your data.
An important thing to remember here is that you should always revisit your KPIs. If you find a better approach to achieving your goals, you should ensure you are tracking the right data. You can do this by monitoring your KPIs regularly with weekly or monthly reports. Once your KPIs have been defined, you have all the information you need to start making strategic decisions and thinking about long-term actions.
Once you’ve selected your KPIs and metrics, it is time to transform them from plain values and numbers into actionable insights. This is done through various data visualizations that will help you tell a story with your indicators and collaborate through them. Plus, it is a well-known fact that the human brain processes visual information way faster than numbers, making it more accessible and easier to understand for a wider audience. Therefore, picking your graphs and charts carefully can make a difference in your analysis process.
That said, it is more challenging than picking a KPI and representing it with a pie chart. Each type of graph and chart has its own purpose and use cases, and you should be careful when picking them. We recommend carefully considering your goals and what you are trying to communicate and choosing the visual that best suits your needs. This is an important point, as picking the wrong visual can mislead your analysis and damage your strategies.
KPIs and metrics are valuable tools for businesses. While key performance indicators tend to be more important, metrics are also helpful to get a bigger picture of the performance of a department or specific area. Today, several data visualization tools offer a range of dashboard options to visualize your KPIs and metrics in a centralized way. Let’s look at it with an example from the construction industry.

The example above, generated with professional construction analytics software, offers the perfect overview of KPIs and metrics to track project performance. The indicators presented in this dashboard are updated in real-time, making it possible to spot any issues early and tackle them to prevent damage. In this case, we can see that the project is 56% complete, with a positive SPI and CPI of over 1. Which means the project is going according to the planned budget and schedule. This could easily change, so it is important to monitor progress closely.
Interactive data analysis has become one of the most significant competitive advantages in the analytical world today. Think about your analytical process as a movie. Your KPIs are the main characters that help you achieve your goals, and your metrics are the side characters that will help you measure the performance of your strategies towards achieving those goals. Your dashboards are the scenery where everything comes together, and you can tell your data story. And interactivity will help you bring everything to life in a compelling way.
Modern KPI reporting tools provide multiple interactivity features to help you navigate and explore your data more thoroughly. For example, a drill down feature enables you to go into lower levels of hierarchical data all in one chart. Let’s say your goal is to increase sales in the US. For that, you are visualizing a chart with sales by country. A drill down would enable you to click on the USA value and adapt the entire chart to see sales by state. Likewise, an even deeper drill down would help you see sales by city or state. Other interactivity options allow you to change the period, translate the text in your charts, and much more.
By making your KPIs and metrics interactive, you’ll ensure that you can extract their maximum potential. A static view of data no longer cuts in today’s fast-paced world, where decisions must be made in an accurate and agile environment.
Vanity metrics refer to the indicators that may look good on paper but do not help inform future business strategies. In some cases, vanity metrics are used to show improvement, but they are actually indicators that are not actionable or related to anything you can consider really significant. A great example of a vanity metric would be with social media followers. Imagine you implemented a campaign that attracted 10.000 new followers to your Instagram. Now, that might seem like a success at first hand, but if from those 10,000 followers, only 50 bought your products or service, then the metric becomes useless.
To avoid facing the issue of vanity metrics, you need to keep your analysis as objective as possible. When choosing the KPIs and metrics you will monitor, always ensure they reflect the truth. While metrics such as the number of followers or likes might seem exciting, they can also point you in the wrong direction. BI tools offer various KPI and dashboard templates that can point you in the right direction to avoid making this mistake.
The next tip for measuring metrics and key performance indicators correctly is setting achievable targets. For your KPIs and metrics to be efficiently measured, you need to know where you are headed and what targets make this possible. Here, you need to be careful not to set unrealistic targets, such as a 50% increase in sales in a year when your average increase in the past years has been 5%. When building targets, consider attainable values based on your business context as well as some industry benchmarks. This way, you will ensure you are working towards achievable goals and avoid getting stacked or disappointed by setting unrealistic values.
Another great practice that will help you measure your metrics and KPIs successfully is to define a monitoring schedule. This will help you stay on top of any insights while still having time to plan and carry out your strategies. Since metrics often track more operational activities, they can be monitored on a short-term basis and even in real-time. On the other hand, KPIs often track strategic goals that are more meaningful when tracked for a more extended period, such as a month, a quarter, or even a year.
Specialized BI tools like professional construction business intelligence software provide intelligent data alerts that will notify you as soon as your KPIs and metrics need your attention. All you have to do is predefine a goal or a threshold value, and the tool will notify you as soon as it is achieved, leaving you more time to focus on other important tasks rather than constantly monitoring your data.
As you’ve learned by now, choosing KPIs and metrics is not a task that can be taken lightly. You need to line up a well-thought-out plan to ensure you are tracking the data that will help you measure the success of your strategies and goals and find improvement opportunities to grow constantly. And, just like many other business-related processes, it requires reassessments to be successful. Our advice is always to take the time to rethink your strategy. Are these metrics still valuable for measuring our efforts? Should we add a couple more? Are they still aligned with our goals?
Doing so will ensure that your resources are used well and that your efforts pay off with successful strategies and continuous organizational growth.
As we reach the end of this post about key performance indicators vs. metrics, we hope you have a deeper understanding of how these two differentiate themselves. The important takeaway from this post is to remember that there would be no KPIs without metrics; both are critical to ensuring a healthy return on investment from your different business activities.
KPIs and metrics are invaluable tools for performance tracking. Every day, more businesses turn to specialized software to get a centralized view of their most important indicators interactively and intuitively. Access to modern dashboard technology allows teams to stay connected and work together towards common business goals.
To keep your mind fresh, here is a small summary of the main differences between metrics and KPIs:
If you are ready to start boosting your construction project’s performance with the help of informed decision-making, then try the RIB Software toolkit today. Our construction analytics solution, RIB BI+, offers companies in the building environment professional features to manage their data in real-time and use it to collaborate and boost efficiency. Book a demo today to benefit from the power of professional data analysis!


Ebook