Wed.Apr 24, 2024

Remove data-transformation-visualization
article thumbnail

Free Course on Tableau For Beginners

Analytics Vidhya

Introduction In the world of data analytics, where every piece of information holds untapped potential, the ability to transform raw data into actionable insights is a game-changer. Tableau, a dynamic and versatile data visualization tool, has revolutionized how organizations harness the power of their data.

article thumbnail

A comparative assessment of digital transformation in Italy

CIO Business Intelligence

It’s universally accepted that to thrive, enterprises must embrace transformation through technology. Digital is a powerful business lever,” says Alessandra Luksch, director of the Digital Transformation Academy Observatory at Politecnico di Milano, which has been mapping trends in ICT spending by Italian organizations since 2016.

Insiders

Sign Up for our Newsletter

This site is protected by reCAPTCHA and the Google Privacy Policy and Terms of Service apply.

Trending Sources

article thumbnail

Alteryx to Dataiku: AutoML

Dataiku

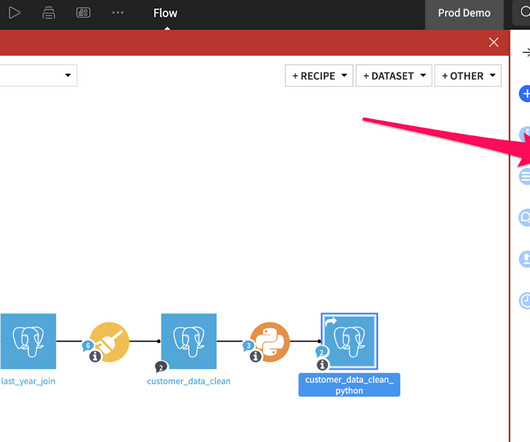
In our last three blogs, we covered how Dataiku’s visual flow can help enhance collaboration and visibility, differences in how you work with datasets , and one of the key tools to accelerate data transformations: recipes. Welcome back to part four of the Alteryx to Dataiku series!

article thumbnail

Run interactive workloads on Amazon EMR Serverless from Amazon EMR Studio

AWS Big Data

EMR Studio is an integrated development environment (IDE) that makes it straightforward for data scientists and data engineers to develop, visualize, and debug analytics applications written in PySpark, Python, and Scala. Now you can use a dataset and visualize your data. option("header", "true").option("inferSchema",

article thumbnail

Get Better Network Graphs & Save Analysts Time

Many organizations today are unlocking the power of their data by using graph databases to feed downstream analytics, enahance visualizations, and more. Critical graph visualizations with overly complex nodes and connections transform into network graphs that are much easier and faster for analysts to understand.

article thumbnail

Learn Data Visualization Techniques for Impactful Visual Representations

FineReport

Learn Data Visualization Understanding the Importance of Visualizing Data Data visualization is a powerful tool for conveying complex information in a clear and impactful manner. Understanding the principles of effective bar chart design is crucial for conveying information accurately and compellingly.

article thumbnail

What is Data Visualization: Complete Guide 2024

FineReport

What is Data Visualization Understanding the Concept Data visualization, in simple terms, refers to the presentation of data in a visual format. By utilizing visual elements, data visualization allows individuals to grasp difficult concepts or identify new patterns within the data.