Remove Data-driven Remove Interactive Remove Recreation/Entertainment Remove Visualization
article thumbnail

Real-Time Interactive Data Visualization Tools Reshaping Modern Business

Smart Data Collective

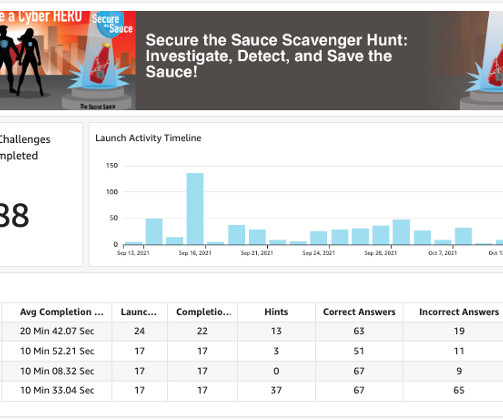
If the work of a human’s mind can be somehow represented, interactive data visualization is the closest form of such representation right before pure art. So, what is Interactive data visualization and how are they driven by modern interactive data visualization tools?

article thumbnail

Data-Driven Pitch Deck Examples for Inspiring the Next Big Screenwriter

Smart Data Collective

Big data has been very important in the creative and entertainment sectors. Many artists are using big data to improve the quality of their work. We mentioned in the past that big data has been very valuable for Hollywood. Professionals throughout the industry are looking for ways to integrate big data into their jobs.

Insiders

Sign Up for our Newsletter

This site is protected by reCAPTCHA and the Google Privacy Policy and Terms of Service apply.

Trending Sources

article thumbnail

5 AI Tools for Rocking Business Presentations

Smart Data Collective

If you are planning on preparing a business presentation in the near future, you should be aware of the best AI-driven tools that can help you make the most of your message. In our AI-driven era , the traditional methods of presenting are being swiftly overshadowed by a myriad of innovative tools that rely heavily on machine learning.

article thumbnail

10 Big Data Examples Showing The Great Value of Smart Analytics In Real Life At Restaurants, Bars, and Casinos

datapine

“You can have data without information, but you cannot have information without data.” – Daniel Keys Moran. When you think of big data, you usually think of applications related to banking, healthcare analytics , or manufacturing. However, the usage of data analytics isn’t limited to only these fields. Discover 10.

Big Data 244
article thumbnail

Monetizing Analytics Features: Why Data Visualizations Will Never Be Enough

Think your customers will pay more for data visualizations in your application? But today, dashboards and visualizations have become table stakes. Five years ago they may have. Discover which features will differentiate your application and maximize the ROI of your embedded analytics. Brought to you by Logi Analytics.

article thumbnail

Make Sure You Know The Difference Between Strategic, Analytical, Operational And Tactical Dashboards

datapine

Exclusive Bonus Content: Download Data Implementation Tips! It helps managers and employees to keep track of the company’s KPIs and utilizes business intelligence to help companies make data-driven decisions. Organizations can also further utilize the data to define metrics and set goals. Digital age needs digital data.

article thumbnail

Entity resolution and fuzzy matches in AWS Glue using the Zingg open source library

AWS Big Data

In today’s data-driven world, organizations often deal with data from multiple sources, leading to challenges in data integration and governance. This process is crucial for maintaining data integrity and avoiding duplication that could skew analytics and insights.