Wed.Apr 28, 2021

article thumbnail

What is Reporting? Meaning & Examples

FineReport

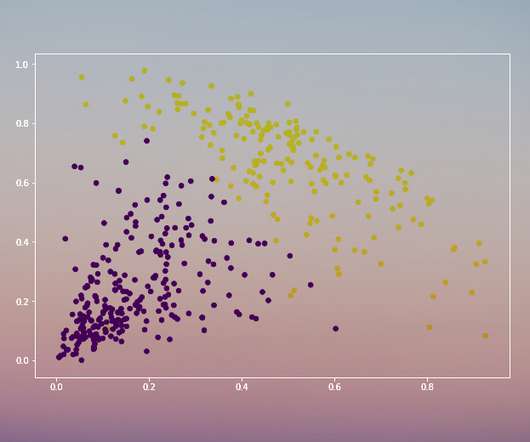
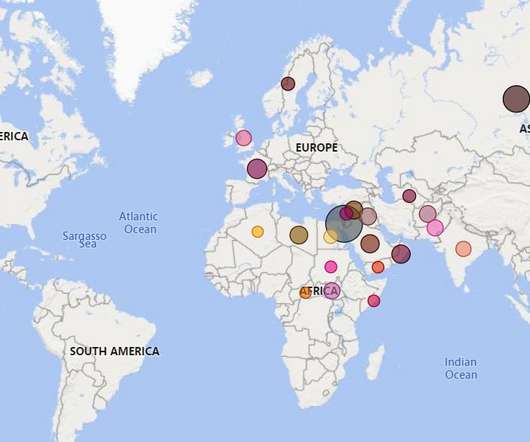
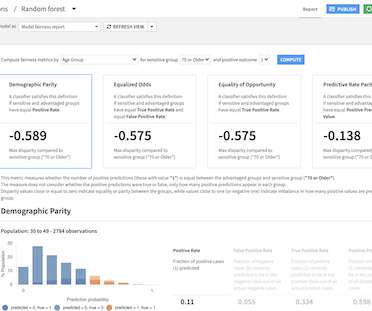
At work, we often hear others talking about reports. But what does reporting mean exactly? There are multiple types of reporting. Can you clearly tell the difference? In this article, I would like to introduce what reporting is and give you some examples to clarify the key concepts. What is Reporting? Reports use tables, charts, and other widgets to display data.

article thumbnail

Short Quiz to Help You Prepare Better for Data Science Interviews

Analytics Vidhya

ArticleVideo Book This article was published as a part of the Data Science Blogathon. Introduction Interviews are the most challenging part of getting. The post Short Quiz to Help You Prepare Better for Data Science Interviews appeared first on Analytics Vidhya.

Insiders

Sign Up for our Newsletter

This site is protected by reCAPTCHA and the Google Privacy Policy and Terms of Service apply.

article thumbnail

DataOps Enables Your Data Fabric

DataKitchen

Industry analysts who follow the data and analytics industry tell DataKitchen that they are receiving inquiries about “data fabrics” from enterprise clients on a near-daily basis. Forrester relates that out of 25,000 reports published by the firm last year, the report on data fabrics and DataOps ranked in the top ten for downloads in 2020. Gartner included data fabrics in their top ten trends for data and analytics in 2019.

article thumbnail

Scikit-learn/ Sklearn Objects – fit() vs transform() vs fit_transform() vs predict()

Analytics Vidhya

ArticleVideo Book This article was published as a part of the Data Science Blogathon. Introduction Sklearn or scikit-learn is no doubt the most useful. The post Scikit-learn/ Sklearn Objects – fit() vs transform() vs fit_transform() vs predict() appeared first on Analytics Vidhya.

article thumbnail

Get Better Network Graphs & Save Analysts Time

Many organizations today are unlocking the power of their data by using graph databases to feed downstream analytics, enahance visualizations, and more. Yet, when different graph nodes represent the same entity, graphs get messy. Watch this essential video with Senzing CEO Jeff Jonas on how adding entity resolution to a graph database condenses network graphs to improve analytics and save your analysts time.

article thumbnail

The Incredible Impact of Blockchain Technology on the Economy

Smart Data Collective

The crypto market is booming once again. After a 2-year long bear market, prices are skyrocketing far and wide, with Bitcoin leading the charge. In November, Investopedia reported that prices of bitcoin rose 111% and they seem to be increasing even further. Bitcoin has tripled in value since it raced past its previous all-time high of $20.000. This has pushed investors, retail and institutional, into a buying frenzy.

article thumbnail

Mixed-effect Regression for Hierarchical Modeling (Part 1)

Analytics Vidhya

ArticleVideo Book Hierarchical Modelling Hierarchical modeling also referred to as a nested model, deals with data with the observations in a certain group. There. The post Mixed-effect Regression for Hierarchical Modeling (Part 1) appeared first on Analytics Vidhya.

Modeling 315

More Trending

article thumbnail

Drawdata – Draw A Customized Data Using Python

Analytics Vidhya

ArticleVideo Book This article was published as a part of the Data Science Blogathon. Overview Introduction Need of data in machine learning Introduction to. The post Drawdata – Draw A Customized Data Using Python appeared first on Analytics Vidhya.

article thumbnail

Preparing for The Most Common Data Science Job Interview Questions

Smart Data Collective

The importance of data in the modern world is hard to overstate. Advancements in AI, machine learning, and platforms such as Google Analytics now mean that masses of data are compiled by businesses on a global scale each day. With big data becoming pivotal in the construction sector and other top industries using data to connect better with customers, information really is crucial to the global economy now.

article thumbnail

Understand Machine Learning Easily Using Python Shapash Library

Analytics Vidhya

ArticleVideo Book This article was published as a part of the Data Science Blogathon. Topics to be covered What is Shapash library The objective. The post Understand Machine Learning Easily Using Python Shapash Library appeared first on Analytics Vidhya.

article thumbnail

#ClouderaLife Spotlight: Suzy Tonini, Talent Researcher

Cloudera

As we continue to work toward diversity, equality, and inclusion in every aspect of our company culture and beyond, we’ve learned so much from our employees’ unique perspectives on allyship. One such employee is Suzy Tonini, a Talent Researcher with a globe-trotting childhood. Growing up with parents who worked for the U.S. State Department, Suzy had the opportunity to hop from country to country with her family, experiencing a variety of cultures. .

IT 98
article thumbnail

Understanding User Needs and Satisfying Them

Speaker: Scott Sehlhorst

We know we want to create products which our customers find to be valuable. Whether we label it as customer-centric or product-led depends on how long we've been doing product management. There are three challenges we face when doing this. The obvious challenge is figuring out what our users need; the non-obvious challenges are in creating a shared understanding of those needs and in sensing if what we're doing is meeting those needs.

article thumbnail

Beginner’s Guide to Clustering in R Program

Analytics Vidhya

ArticleVideo Book This article was published as a part of the Data Science Blogathon. R you ready? Let’s learn clustering in R. What is. The post Beginner’s Guide to Clustering in R Program appeared first on Analytics Vidhya.

article thumbnail

Making Customer Experience Your Competitive Advantage

Teradata

Customers expect organizations to know them, provide relevant & personalized experiences, and be good stewards of their data. Yet many businesses still struggle with this. Why?

91
article thumbnail

Learn how to get insights from Azure SQL Database: A sample data analytics project using Global Peace Index data

Analytics Vidhya

ArticleVideo Book This article was published as a part of the Data Science Blogathon. Introduction Are you passionate about the empirical investigation to find. The post Learn how to get insights from Azure SQL Database: A sample data analytics project using Global Peace Index data appeared first on Analytics Vidhya.

article thumbnail

A Review of Data Storytelling Solutions

Juice Analytics

If you are in the data or analytics industry, it is worth getting to know Ted Cuzzillo. He’s been following our industry since 2007, was covering Tableau as an industry analyst before anyone else, and wrote for esteemed publications TDWI and Information Management. He knows the analytics landscape. And he’s always looking for what’s next. His new venture, DataDoodle , is explicit in where he has set his sights: he is exploring nascent trends and vendors in the area of smarter cities and data nar

article thumbnail

Beyond the Basics of A/B Tests: Highly Innovative Experimentation Tactics You Need to Know

Speaker: Timothy Chan, PhD., Head of Data Science

Are you ready to move beyond the basics and take a deep dive into the cutting-edge techniques that are reshaping the landscape of experimentation? 🌐 From Sequential Testing to Multi-Armed Bandits, Switchback Experiments to Stratified Sampling, Timothy Chan, Data Science Lead, is here to unravel the mysteries of these powerful methodologies that are revolutionizing how we approach testing.

article thumbnail

Dealing with Anomalies in the data

Analytics Vidhya

ArticleVideo Book This article was published as a part of the Data Science Blogathon. What are Anomalies and to detect them? What impact. The post Dealing with Anomalies in the data appeared first on Analytics Vidhya.

article thumbnail

Design Robust, Transparent ML Models Faster With Dataiku 9

Dataiku

Building robust and transparent predictive models is critical to trust and adoption from the business — but it’s notoriously time consuming to ensure models meet best practices standards, work on both "easy" and edge cases, and fulfill many other quality criteria. There are no shortcuts, as quality breaches in AI are what news headlines are made of.

article thumbnail

How to Persuade Decision Makers to Move to Modern Planning Solutions

Jet Global

Most growing businesses rely upon collections of spreadsheets and manual processes to manage their financial planning and budgeting processes. Finance teams generate revenue forecasts for each region or product line and then roll them up to executive leadership. Department heads build up their wish lists for the coming year, including requests for new initiatives.

article thumbnail

Check Out the Second Video in Our Snowflake Tutorial Series

CDW Research Hub

Welcome back to Sirius’ Snowflake Immersion Days video series. These virtual learning sessions are designed to provide technical hands-on training for data engineers and data analysts. Our certified experts will guide you through exercises that take a deep dive into the data cloud and data platforms, and how to make the most of the timely insights they provide.

article thumbnail

Manufacturing Sustainability Surge: Your Guide to Data-Driven Energy Optimization & Decarbonization

Speaker: Kevin Kai Wong, President of Emergent Energy Solutions

In today's industrial landscape, the pursuit of sustainable energy optimization and decarbonization has become paramount. Manufacturing corporations across the U.S. are facing the urgent need to align with decarbonization goals while enhancing efficiency and productivity. Unfortunately, the lack of comprehensive energy data poses a significant challenge for manufacturing managers striving to meet their targets.