

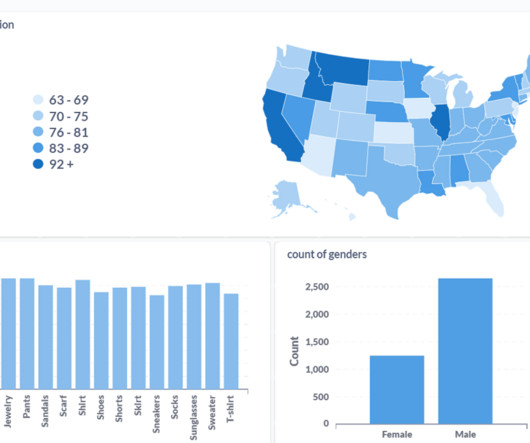
Open-Source BI Tool Metabase for Data Visualization and Analytics
Analytics Vidhya
JANUARY 26, 2024
Learning […] The post Open-Source BI Tool Metabase for Data Visualization and Analytics appeared first on Analytics Vidhya. In today’s data-driven world, BI platforms like Metabase are essential for extracting insights and facilitating informed decision-making.


Let's personalize your content