


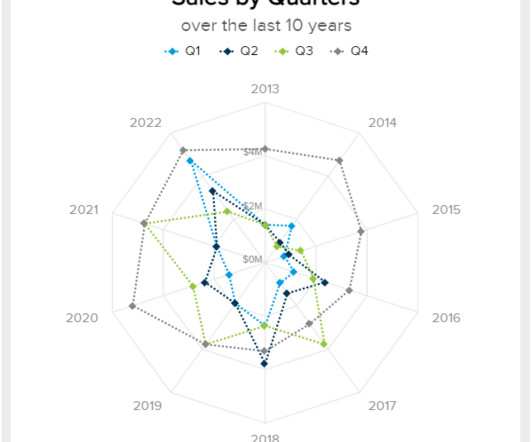
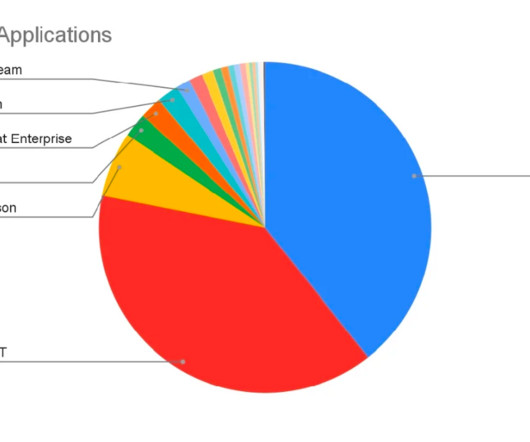
What is the Tableau Developer Salary in India?
Analytics Vidhya
SEPTEMBER 26, 2023
Introduction Tableau has emerged as a popular data visualization tool in companies, making it one of the hottest trends in Business Intelligence. We will […] The post What is the Tableau Developer Salary in India? In India, people are curious about the Tableau developer salary statistics.


Let's personalize your content