Remove 2009 Remove Experimentation Remove Metrics Remove Statistics
article thumbnail

The Lean Analytics Cycle: Metrics > Hypothesis > Experiment > Act

Occam's Razor

To win in business you need to follow this process: Metrics > Hypothesis > Experiment > Act. We are far too enamored with data collection and reporting the standard metrics we love because others love them because someone else said they were nice so many years ago. That metric is tied to a KPI.

Metrics 156
article thumbnail

Understanding Simpson’s Paradox to Avoid Faulty Conclusions

Sisense

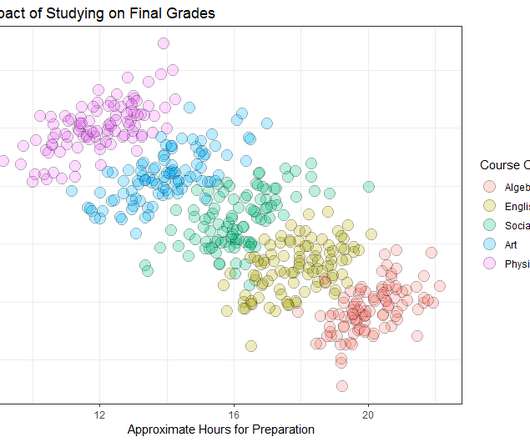
One of the simplest ways to start exploring your data is to aggregate the metrics you are interested in by their relevant dimensions. This is an example of Simpon’s paradox , a statistical phenomenon in which a trend that is present when data is put into groups reverses or disappears when the data is combined.

Testing 104
article thumbnail

Themes and Conferences per Pacoid, Episode 9

Domino Data Lab

If your “performance” metrics are focused on predictive power, then you’ll probably end up with more complex models, and consequently less interpretable ones. They also require advanced skills in statistics, experimental design, causal inference, and so on – more than most data science teams will have.