Remove 2011 Remove Business Intelligence Remove Testing Remove Visualization
article thumbnail

Accomplish Agile Business Intelligence & Analytics For Your Business

datapine

When encouraging these BI best practices what we are really doing is advocating for agile business intelligence and analytics. Therefore, we will walk you through this beginner’s guide on agile business intelligence and analytics to help you understand how they work and the methodology behind them.

article thumbnail

Themes and Conferences per Pacoid, Episode 8

Domino Data Lab

Note that data warehouse (DW) and business intelligence (BI) practices both emerged circa 1990. Fun fact: in 2011 Google bought remnants of what had previously been Motorola. data to train and test models poses new challenges: The need for reproducibility in analytics workflows becomes more acute.

Insiders

Sign Up for our Newsletter

This site is protected by reCAPTCHA and the Google Privacy Policy and Terms of Service apply.

Trending Sources

article thumbnail

Unlock The Power of Your Data With These 19 Big Data & Data Analytics Books

datapine

He founded the project Apache Storm in 2011, which turned to be “one of the world’s most popular stream processors and has been adopted by many of the world’s largest companies, including Yahoo!, At this point, turning to self-service business intelligence would be the most affordable and effective solution.

Big Data 263
article thumbnail

How The Cloud Made ‘Data-Driven Culture’ Possible | Part 1

BizAcuity

Google launches Google Cloud Storage and Google Workspace Marketplace to make business on the cloud easier. 2011: IBM enters the cloud market with IBM SmartCloud. Microsoft also releases Power BI, a data visualization and business intelligence tool. [You can read more on IaaS, PaaS and SaaS here ]. About BizAcuity.

article thumbnail

Showpad accelerates data maturity to unlock innovation using Amazon QuickSight

AWS Big Data

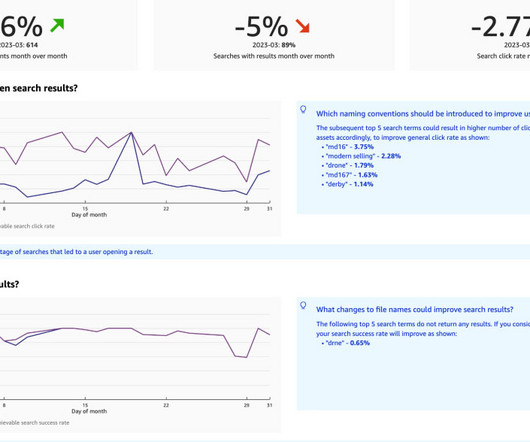
The company decided to use AWS to unify its business intelligence (BI) and reporting strategy for both internal organization-wide use cases and in-product embedded analytics targeted at its customers. Showpad migrated over 70 dashboards with over 1,000 visuals.