
Best practices to implement near-real-time analytics using Amazon Redshift Streaming Ingestion with Amazon MSK
AWS Big Data
MARCH 11, 2024
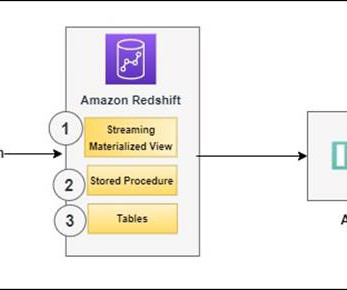
Establish connectivity between an Amazon QuickSight dashboard and Amazon Redshift to deliver visualization and insights. Create a user-facing table in the Redshift cluster and use dot notation to unnest the JSON document from the streaming materialized view into data columns of the table.


Let's personalize your content