Remove 2017 Remove ROI Remove Statistics Remove Visualization
article thumbnail

Themes and Conferences per Pacoid, Episode 5

Domino Data Lab

more depth in the case studies), plus different styles of instruction (“ROI” gets discussed, a lot) are needed. If you haven’t seen R2D3 ’s excellent A visual introduction to machine learning series, part 1 and part 2 … run, do not walk, to your nearest browser and check that out! Wes McKinney (2017). Aurélien Géron (2017).

article thumbnail

Unleash the Power of Advanced Analytics with the Sisense Q4 2019 Release

Sisense

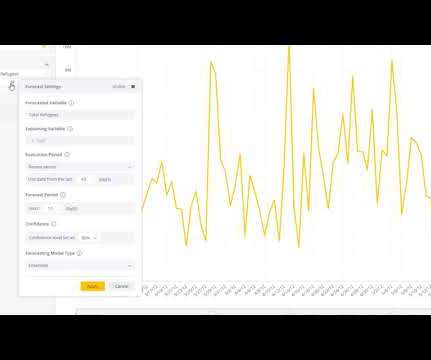
Data is the New Oil” was coined by The Economist in May 2017 and became a mantra for organizations to drive new wealth from data. Business users can independently compare the forecast with actual values for the last period, view the respective weights of the statistical model, and change inputs to fine-tune their forecast.

Insiders

Sign Up for our Newsletter

This site is protected by reCAPTCHA and the Google Privacy Policy and Terms of Service apply.

article thumbnail

Themes and Conferences per Pacoid, Episode 9

Domino Data Lab

Finale Doshi-Velez, Been Kim (2017-02-28) ; see also the Domino blog article about TCAV. Adrian Weller (2017-07-29). “ On the other hand, as Lipton emphasized, while the tooling produces interesting visualizations, visualizations do not imply interpretation. ML model interpretability and data visualization.

article thumbnail

Themes and Conferences per Pacoid, Episode 12

Domino Data Lab

He’s been out of Wolfram for a while and writing exquisite science books including Elements: A Visual Explanation of Every Known Atom in the Universe and Molecules: The Architecture of Everything. Most fascinating moment: got to chat with Theodore Gray , co-founder of Wolfram Research and the inventor of notebooks (back in the 1980s).

article thumbnail

What is Augmented Analytics and Why Does it Matter?

Smarten

You may also have read the recent Gartner report entitled, ‘Augmented Analytics Is the Future of Data and Analytics’ , Published 27 July 2017, by Rita L. Users can perform advanced analytics in an easy-to-use, drag and drop interface without knowledge of statistical analysis or algorithms.

article thumbnail

What is SSDP and Can it Truly Make Analytics Self-Serve?

Smarten

SSDP allows average business users to compile and prepare data and use that data in analytics to test hypotheses, visualize and share data, prepare reports and support day-to-day tasks with complete drill-down and drill-through capability, custom alerts and mobile access that supports the needs of every team member.