article thumbnail

Reporting Solutions: A Complete Guide

FineReport

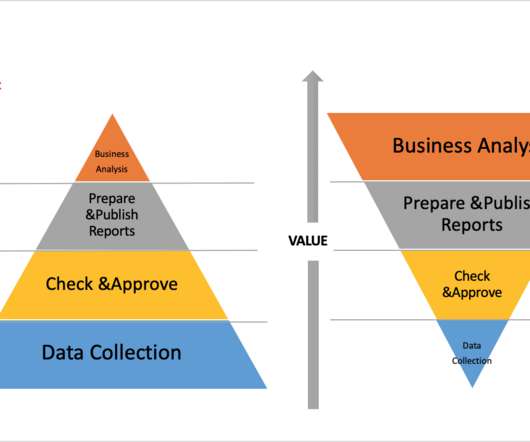
Besides, reporting solutions support managers put together a picture of the relevant data and discover business insides. For most companies, the staffs spend 50% time on data collection, 30% time on checking and approving the data, 15% time on developing and publishing the reports, and 5% on business analysis.

article thumbnail

Financial Statements: Types, Examples, and Analysis

FineReport

” The income statement presents the enterprise’s operating results during a defined accounting period. FineReport supports various data sources, aiding enterprises in rapidly constructing data centers. How are the Three Financial Statements Presented?

Insiders

Sign Up for our Newsletter

This site is protected by reCAPTCHA and the Google Privacy Policy and Terms of Service apply.

Trending Sources

article thumbnail

Financial Dashboard: Definition, Examples, and How-tos

FineReport

A financial dashboard, one of the most important types of data dashboards , functions as a business intelligence tool that enables finance and accounting teams to visually represent, monitor, and present financial key performance indicators (KPIs). You can download FineReport for free and have a try!

article thumbnail

Top 10 Key Features of BI Tools in 2020

FineReport

The metadata here is focused on the dimensions, indicators, hierarchies, measures and other data required for business analysis. It also includes some processed data, such as KPI, personal sales, single product sales and other data.