Remove Data Enablement Remove Data Lake Remove Data Warehouse Remove Visualization
article thumbnail

Amazon Redshift announcements at AWS re:Invent 2023 to enable analytics on all your data

AWS Big Data

In 2013, Amazon Web Services revolutionized the data warehousing industry by launching Amazon Redshift , the first fully-managed, petabyte-scale, enterprise-grade cloud data warehouse. Amazon Redshift made it simple and cost-effective to efficiently analyze large volumes of data using existing business intelligence tools.

article thumbnail

Improve healthcare services through patient 360: A zero-ETL approach to enable near real-time data analytics

AWS Big Data

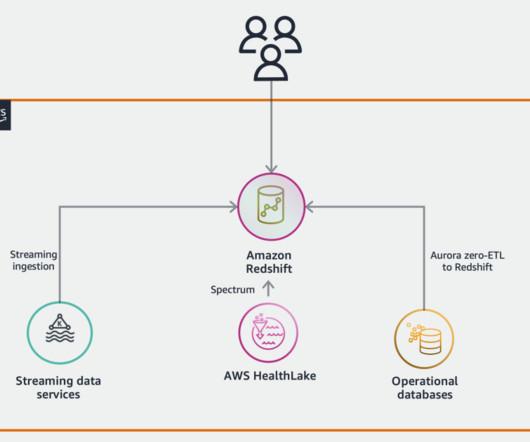
This means you can seamlessly combine information such as clinical data stored in HealthLake with data stored in operational databases such as a patient relationship management system, together with data produced from wearable devices in near real-time. To get started with this feature, see Querying the AWS Glue Data Catalog.

Insiders

Sign Up for our Newsletter

This site is protected by reCAPTCHA and the Google Privacy Policy and Terms of Service apply.

Trending Sources

article thumbnail

DataOps For Business Analytics Teams

DataKitchen

Data scientists derive insights from data while business analysts work closely with and tend to the data needs of business units. Business analysts sometimes perform data science, but usually, they integrate and visualize data and create reports and dashboards from data supplied by other groups.

article thumbnail

Exploring real-time streaming for generative AI Applications

AWS Big Data

Streaming data facilitates the constant flow of diverse and up-to-date information, enhancing the models’ ability to adapt and generate more accurate, contextually relevant outputs. OpenSearch Service offers visualization capabilities powered by OpenSearch Dashboards and Kibana (1.5

article thumbnail

Quantitative and Qualitative Data: A Vital Combination

Sisense

As quantitative data is always numeric, it’s relatively straightforward to put it in order, manage it, analyze it, visualize it, and do calculations with it. Spreadsheet software like Excel, Google Sheets, or traditional database management systems all mainly deal with quantitative data.

article thumbnail

The Gartner 2021 Leadership Vision for Data & Analytics Leaders Webinar Q&A

Andrew White

As such any Data and Analytics strategy needs to incorporate data sovereignty as per of its D&A governance program. Coding skills – SQL, Python or application familiarity – ETL & visualization? Data and Analytics Governance: Whats Broken, and What We Need To Do To Fix It. I didn’t mean to imply this.

article thumbnail

What is a Data Pipeline?

Jet Global

A data pipeline is a series of processes that move raw data from one or more sources to one or more destinations, often transforming and processing the data along the way. Data pipelines support data science and business intelligence projects by providing data engineers with high-quality, consistent, and easily accessible data.