article thumbnail

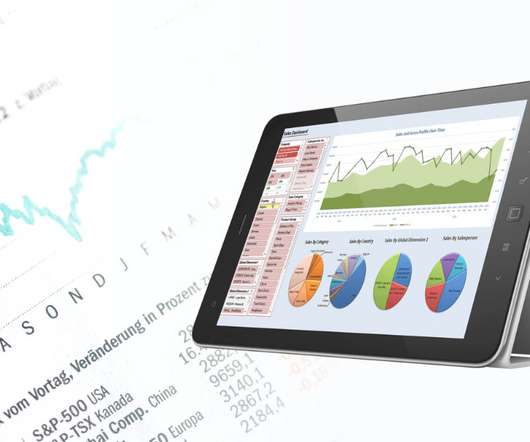
Bridge the Gap Between Reporting and Data Visualization in Power BI

Jet Global

Business intelligence is a key tool, empowering companies to get the most out of their data by providing tools to analyze information, streamline operations, track performance, and inform decision-making. Power BI can generate easy-to-read visualizations that help stakeholders perform key analysis.

article thumbnail

Reporting Analytics vs. Financial Reporting: Is There a Difference?

Jet Global

Broadly speaking, these kinds of reports fall under the heading of “operational reporting”, because you use them as part of routine operations rather than as a financial management tool. In contrast with financial reporting, analytics tends to cast a much wider net in terms of its overall purpose and objectives.

Insiders

Sign Up for our Newsletter

This site is protected by reCAPTCHA and the Google Privacy Policy and Terms of Service apply.

Trending Sources

article thumbnail

Navigating Data Entities, BYOD, and Data Lakes in Microsoft Dynamics

Jet Global

Online analytical processing (OLAP), which enabled users to quickly and easily view data along different dimensions, was coming of age. The challenge with OLAP, however, is that it requires intensive processing power to aggregate data according to various categories or dimensions. Data warehouses have been in widespread use for years.

article thumbnail

The Missing Link in Your Power BI/ERP Data Chain

Jet Global

Business intelligence empowers businesses to get the most out of their data by providing tools to analyze information, streamline operations, track performance, and inform decision-making. In the Microsoft Dynamics ecosystem, Power BI generates easy-to-read visualizations that help stakeholders perform key analysis. Access Resource.

article thumbnail

How to Get Data from Microsoft D365 BC into Power BI

Jet Global

Microsoft Power BI is a popular tool for designing visual dashboards that help everyone in your organization to better understand how the company is performing against key metrics. Naturally, most companies will want the capability to include that kind of additional information in financial and operational reports.

article thumbnail

What Is Embedded Analytics?

Jet Global

Plus, there is an expectation that tools be visually appealing to boot. In the past, data visualizations were a powerful way to differentiate a software application. Their dashboards were visually stunning. Today, free visualizations seem to be everywhere. It’s all about context. End users expect more from analytics too.