Remove 2012 Remove Business Intelligence Remove Interactive Remove Visualization
article thumbnail

Introduction To The Basic Business Intelligence Concepts

datapine

This concept is known as business intelligence. Business intelligence, or “BI” for short, is becoming increasingly prevalent across industries each year. But with business intelligence concepts comes a great deal of confusion, and ultimately – unnecessary industry jargon. Learn here! But more on that later.

article thumbnail

Take Your SQL Skills To The Next Level With These Popular SQL Books

datapine

Business leaders, developers, data heads, and tech enthusiasts – it’s time to make some room on your business intelligence bookshelf because once again, datapine has new books for you to add. We have already given you our top data visualization books , top business intelligence books , and best data analytics books.

Insiders

Sign Up for our Newsletter

This site is protected by reCAPTCHA and the Google Privacy Policy and Terms of Service apply.

article thumbnail

Perform time series forecasting using Amazon Redshift ML and Amazon Forecast

AWS Big Data

When the model is ready, it can be accessed using SQL from within Amazon Redshift using any business intelligence (BI) tool. to create forecast tables and visualize the data. Time series data is plottable on a line graph and such time series graphs are valuable tools for visualizing the data.

article thumbnail

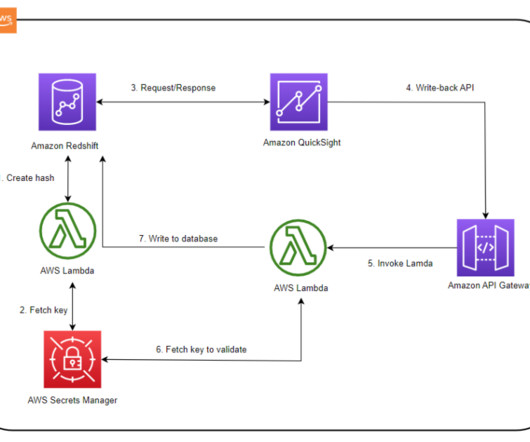
Perform secure database write-backs with Amazon QuickSight

AWS Big Data

Create a QuickSight visual This step involves creating a table visual that uses a calculated field to pass parameters to API Gateway and invoke the preceding Lambda function. The following screenshot shows a sample table visual. See [link] # We rethrow the exception by default. Raji Sivasubramaniam is a Sr.

article thumbnail

Performance Dashboard: Facilitate The Performance of Your Business

FineReport

Performance dashboard can help you deal with various business problems. Performance dashboard is a data visualization tool for management, which is often used to measure employees’ performance, while helping business personnel measure, monitor, and manage the key activities and processes required to achieve business goals.

article thumbnail

Upcoming Power BI Workshop in Huntington Beach, CA – Apr 10, 2015

Ms SQL Girl

Actionable Visualization In Power BI. Creating Interactive Visualisation for Actionable Analytics. Julie Koesmarno, SQL Server MVP, MCSE Data Platform, MCSE Business Intelligence, Microsoft Certified Trainer, is a SQL Server and BI consultant, with a Bachelor’s degree in IT. I look forward to seeing you there!