Remove 2019 Remove Dashboards Remove Data Warehouse Remove Prescriptive Analytics
article thumbnail

Top Database Reporting Tools You Can’t Miss (For Sql, Oracle and NoSQL)

FineReport

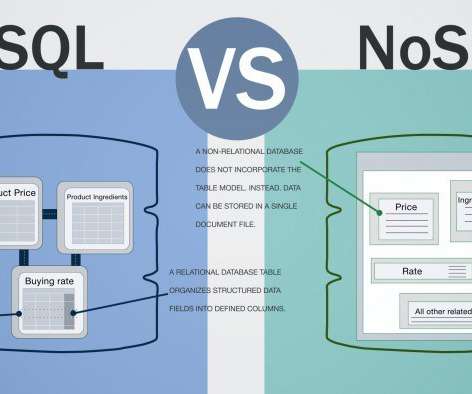
Database reporting tools are the reporting software that helps you directly generate reports of the data from the database or the data warehouse you use. There are two types of databases used in the company or organizations: relational databases and NoSQL data sources. . What is database reporting tools? From Google.

article thumbnail

Data Visualization and Visual Analytics: Seeing the World of Data

Sisense

Simply put, data visualization means showing data in a visual format that makes insights easier to understand for human users. Data is usually visualized in a pictorial or graphical form such as charts, graphs, lists, maps, and comprehensive dashboards that combine these multiple formats.

Insiders

Sign Up for our Newsletter

This site is protected by reCAPTCHA and the Google Privacy Policy and Terms of Service apply.

Trending Sources

article thumbnail

The Gartner 2021 Leadership Vision for Data & Analytics Leaders Webinar Q&A

Andrew White

See recorded webinars: Emerging Practices for a Data-driven Strategy. Data and Analytics Governance: Whats Broken, and What We Need To Do To Fix It. Link Data to Business Outcomes. Does Data warehouse as a software tool will play role in future of Data & Analytics strategy? Would you agree?

article thumbnail

What Is Embedded Analytics?

Jet Global

Their dashboards were visually stunning. In turn, end users were thrilled with the bells and whistles of charts, graphs, and dashboards. As rich, data-driven user experiences are increasingly intertwined with our daily lives, end users are demanding new standards for how they interact with their business data.